Published online Apr 21, 2017. doi: 10.3748/wjg.v23.i15.2771
Peer-review started: December 6, 2016
First decision: December 29, 2016
Revised: January 13, 2017
Accepted: February 17, 2017
Article in press: February 17, 2017
Published online: April 21, 2017
To identify a panel of biomarkers that can distinguish between non-alcoholic fatty liver disease (NAFLD) and non-alcoholic steatohepatitis (NASH), and explore molecular mechanism involved in the process of developing NASH from NAFLD.
Biomarkers may differ during stages of NAFLD. Urine and blood were obtained from non-diabetic subjects with NAFLD and steatosis, with normal liver function (n = 33), from patients with NASH, with abnormal liver function (n = 45), and from healthy age and sex-matched controls (n = 30). Samples were subjected to metabolomic analysis to identify potential non-invasive biomarkers. Differences in urinary metabolic profiles were analyzed using liquid chromatography tandem mass spectrometry with principal component analysis and partial least squares-discriminate analysis.
Compared with NAFLD patients, patients with NASH had abnormal liver function and high serum lipid concentrations. Urinary metabonomics found differences in 31 metabolites between these two groups, including differences in nucleic acids and amino acids. Pathway analysis based on overlapping metabolites showed that pathways of energy and amino acid metabolism, as well as the pentose phosphate pathway, were closely associated with pathological processes in NAFLD and NASH.
These findings suggested that a panel of biomarkers could distinguish between NAFLD and NASH, and could help to determine the molecular mechanism involved in the process of developing NASH from NAFLD. Urinary biomarkers may be diagnostic in these patients and could be used to assess responses to therapeutic interventions.
Core tip: To identify biomarkers that can distinguish between nonalcoholic fatty liver disease (NAFLD) and nonalcoholic steatohepatitis (NASH), urine and blood were obtained from patients with NAFLD and NASH, and healthy controls. Urinary metabonomics found differences in 31 metabolites between NAFLD and NASH, including nucleic acids and amino acids. Pathway analysis showed that pathways of energy metabolism, amino acid metabolism, and the pentose phosphate pathway, were closely associated with the pathological processes in NAFLD and NASH. These biomarkers could distinguish between NAFLD and NASH, and could help to determine the mechanism involved in the development of NASH from NAFLD.
- Citation: Dong S, Zhan ZY, Cao HY, Wu C, Bian YQ, Li JY, Cheng GH, Liu P, Sun MY. Urinary metabolomics analysis identifies key biomarkers of different stages of nonalcoholic fatty liver disease. World J Gastroenterol 2017; 23(15): 2771-2784
- URL: https://www.wjgnet.com/1007-9327/full/v23/i15/2771.htm
- DOI: https://dx.doi.org/10.3748/wjg.v23.i15.2771
Nonalcoholic fatty liver disease (NAFLD) comprises a spectrum of pathological conditions, including simple steatosis, nonalcoholic steatohepatitis (NASH), and cirrhosis. NAFLD has been estimated to affect approximately 15%-30% of the general population and its prevalence is increasing worldwide[1,2]. The prevalence of NAFLD is strongly linked to obesity, insulin resistance, and a cluster of metabolic disorders, including hypertriglyceridemia and hyperuricemia[3], which impair health seriously[4].
No standard treatment exists currently to manage NAFLD, or even NASH, in western medicine[5]. Weight loss regimens, including restricted calorie diets, bariatric surgery, and drug-induced fat malabsorption, only improve the condition to some degree[6-8]. Identification of metabolic differences among the stages of NAFLD might result in the development of more effective and specific treatments for NAFLD and NASH.
Urine metabonomics[9] is a good method to assess metabolic differences among different stages of NAFLD. Although urinary metabolomics data have been obtained in patients with NAFLD, NASH, and liver cirrhosis[10], to date, few studies have used this method to compare patterns in patients at different stages of NAFLD. This study aimed to investigate correlations between disease stages and urine metabonomics in patients with NAFLD, specifically to determine whether urine metabonomics could be used to distinguish NAFLD from NASH. In addition, this study sought to determine the molecular mechanisms involved in the development of NASH from NAFLD.
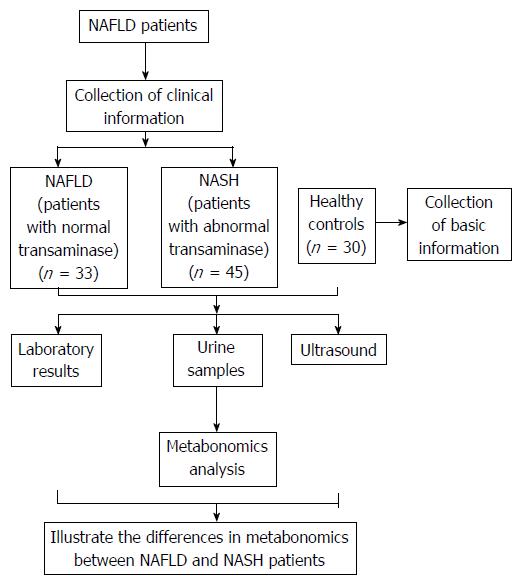
The randomized clinical trial evaluated patients seen at the NAFLD outpatient clinic of Shuguang Hospital Affiliated to Shanghai University of Traditional Chinese Medicine from January 2013 to May 2014. Healthy volunteer controls were enrolled from among employees of the medical center. Figure 1 provides an overview of the study. A total of 108 subjects were recruited, 33 in the NAFLD group, which included patients with steatosis and normal liver function; 45 in the NASH group, which included patients with steatohepatitis and abnormal liver function; and 30 healthy controls. All subjects provided written informed consent.
General information recorded at each participant’s first visit to a doctor included age, gender, and medical history. The results of laboratory tests and ultrasound were also recorded. Urine samples for metabolic profiling were collected from participants at their second visit.
The diagnostic criteria for NAFLD included: (1) a history of no or limited daily alcohol intake (< 20 g for women and < 30 g for men); (2) the presence of hepatic steatosis by imaging or histology; and (3) the exclusion of all other liver diseases[11]. The diagnostic criteria for NASH included: (1) a diagnosis of NAFLD, as above; and (2) a significant increase in alanine aminotransferase (ALT) activity or other liver function parameters.
Males and females aged 18-60 years, without medication, were eligible following a screening test to confirm the presence of NAFLD. Based on their symptoms and the results of liver function tests, NAFLD patients were divided into NAFLD and NASH groups, consisting of patients with normal and abnormal liver function, respectively.
Patients were excluded if they: (1) had a history of diabetes mellitus or any metabolic disease; (2) consumed > 20 g alcohol per day; (3) had acute diseases or other untreated illness requiring treatment; (4) had impaired hepatic or renal functions; (5) were female of childbearing age who were pregnant, lactating, or unwilling to use an effective form of birth control; (6) had medication or other treatment before; or (7) had a history or presence of any condition that, in the investigator’s opinion, would endanger the individual’s safety or affect the study results.
Urine samples were collected from each participant during mid-morning and were centrifuged at 4 °C for 15 min at 1509.3 × g. The supernatants were frozen and stored at -80 °C until analysis. If required, urine samples were transported using Drikold.
Pretreatment: 100 μL of urine and 300 μL of acetonitrile were vortexed for 3 min and then centrifuged at 12000 r/min, 4 °C for 10 min. Supernatants were kept as prepared samples for further analysis.
Liquid chromatography (LC) separation was performed on an Agilent 1200 series LC system (Agilent, CA, United States). Aliquots of 2 μL of the prepared samples were injected into a Waters Shield C18 column (3.5 μm, 2.1 mm × 150 mm) maintained at 20 °C, and eluted with a mobile phase of 0.01% formic acid in water-acetonitrile (90:10) at a flow rate of 0.3 mL/min. MS detection was performed on an API 4000 triple quadrupole mass spectrometer (Sciex Applied Biosystems), using positive electronic spray ionization in multiple reaction monitoring mode, and at a source temperature of 700 °C and a voltage of 5500 V. The dwell time for the multiple reaction monitoring mode was 0.08 s. Nitrogen was used as the curtain, nebulizer, and collision gas, at pressures of 50, 60, and 70 psi, respectively. Certain ion transitions for amino acids and their internal standards were monitored, and peak area ratios of amino acids to internal standards were calculated after correcting for transition overlaps of natural leucine and isoleucine[12].
Compounds were identified by comparison with library entries of purified standards and recurrent unknown entities. Known chemical entities were identified based on comparisons with metabolomic library entries of more than 2362 commercially available purified standards and an online database (http://metlin.scripps.edu/). In addition, currently unknown entities were identified by their recurrent nature[13].
Data were analyzed by parametric and nonparametric statistical tests using SPSS (version 16) and Simca-P (version 11.0). Continuous data were compared by one-way ANOVA. Differences in metabolic profiles on LC/MS were determined by principal component analysis (PCA) and partial least squares discriminant analysis (PLS-DA).
To validate the importance of the metabolites, and to further gauge their ability to distinguish among patients with NASH and NAFLD and healthy controls, their potential predictive utility for the process of NAFLD was assessed by receiver operating characteristic (ROC) curve analysis. ROC analysis was performed using MS peak areas corresponding to the metabolite concentrations in each of the three subject groups. Areas under the ROC curve were calculated using the ROCR package (classifier visualization in R).
The measurements from each patient’s laboratory test results were entered into an Excel spreadsheet, followed by re-checking of all data to ensure accuracy.
There were no significant differences among the three groups in terms of patient number, age, and height. Weight and body mass index (BMI) were significantly higher in the NAFLD and NASH groups compared with those in the control group (Table 1).
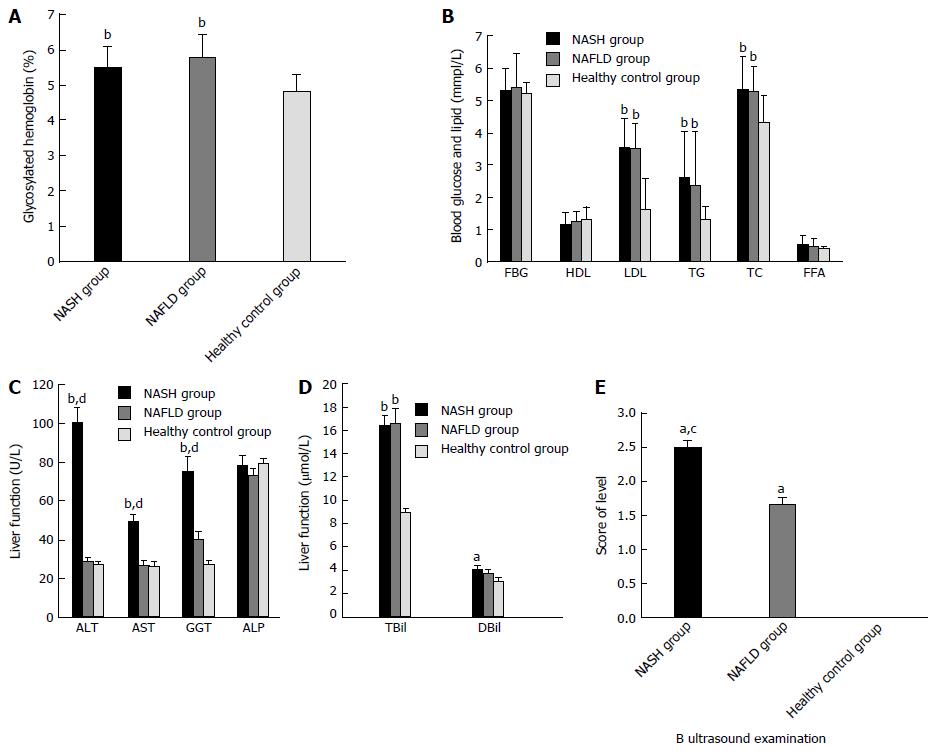
Compared with the healthy group, patients with NAFLD and NASH had much higher concentrations of glycosylated hemoglobin (HbA1c), low-density lipoprotein-cholesterol (LDL), triglycerides (TG), total cholesterol (TC), ALT, aspartate aminotransferase (AST), gamma-glutamyl transferase (GGT), and total bilirubin (TBiL). Compared with the NAFLD group, patients with NASH had much higher ALT, AST, and GGT concentrations, and significantly different results on ultrasound examinations (Table 2 and Figure 2).
| Group | NASH | NAFLD | Healthy group |
| HbA1C (%) | 5.51 ± 0.58b | 5.8 ± 0.62b | 4.83 ± 0.47 |
| FBG (mmpl/L) | 5.31 ± 0.69 | 5.4 ± 1.05 | 5.25 ± 0.33 |
| HDL (mmpl/L) | 1.2 ± 0.36 | 1.28 ± 0.3 | 1.33 ± 0.37 |
| LDL (mmpl/L) | 3.57 ± 0.88b | 3.53 ± 0.77b | 1.64 ± 0.95 |
| TG (mmpl/L) | 2.62 ± 1.4b | 2.39 ± 1.64b | 1.32 ± 0.41 |
| TC (mmpl/L) | 5.37 ± 0.98b | 5.3 ± 0.77b | 4.32 ± 0.83 |
| FFA (mmpl/L) | 0.58 ± 0.25 | 0.5 ± 0.24 | 0.44 ± 0.05 |
| ALT (U/L) | 100.66 ± 48.4bd | 28.9 ± 10.76 | 27.36 ± 9.76 |
| AST (U/L) | 49.68 ± 23.1bd | 27.17 ± 12.74 | 26.41 ± 13.05 |
| GGT (U/L) | 75.26 ± 53.1bd | 40.25 ± 23.66 | 27.39 ± 12.04 |
| ALP (U/L) | 78.5 ± 33.31 | 73.43 ± 17.05 | 79.1 ± 16.02 |
| TBil (μmol/L) | 16.42 ± 6.24b | 16.63 ± 7.04b | 8.99 ± 1.92 |
| DBil (μmol/L) | 4.07 ± 2.18 | 3.7 ± 1.72 | 3.05 ± 1.34 |
| B ultrasound examination | 2.51 ± 0.55ac | 1.67 ± 0.48a | 0 ± 0 |
PCA was performed using samples from the three groups. S-plots showed obvious metabolic differences among these three groups (Figure 3). This was followed by pair-wise comparisons.
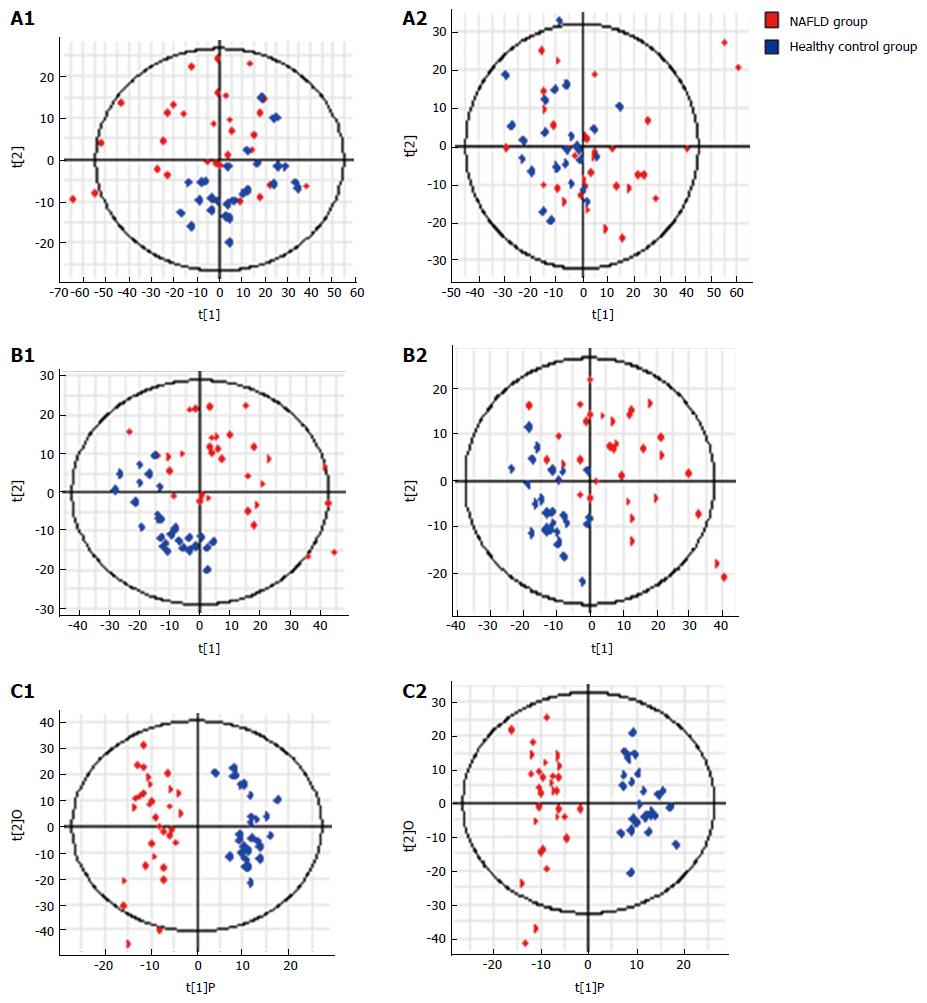
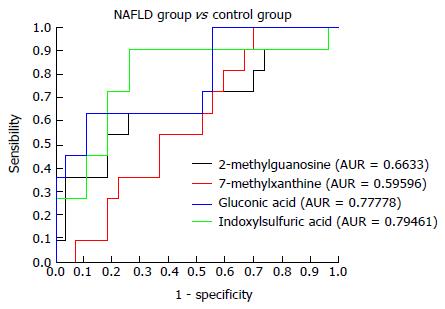
NAFLD group vs control group: Urinary metabonomics were used to assess differences between the NAFLD and control groups. PCA showed a spectral separation between these two groups, indicating significant metabolic differences. This was further supported by PLS-DA and orthogonal projections to latent structures-discriminant analysis (OPLS-DA) (Figure 4). After filtering out interference signals, 53 different metabolites were detected; mainly nucleic acids and amino acids (Table 3). The concentrations of the nucleic acid metabolites hypoxanthine, xanthine, and carnitine were lower in the urine of patients with NAFLD than in the control subjects. In addition, the concentrations of the amino acid metabolites, citrulline, arginine, valine, and indole acetic acid, as well as glucose and gluconic acid, were higher in patients with NAFLD than in the controls. ROC analysis, performed to identify the key metabolites that could distinguish NAFLD patients from healthy individuals, found that 7-methylxanthine, 2-methylguanosine, gluconic acid, and indoxylsulfuric acid were markers for NAFLD (Figure 5).
| No. | Metabolites | VIP-value (OPLS-DA) | P value (t-test) | Fold change |
| ESI+ | ||||
| 1 | L-Carnitine | 1.488 | 0.002 | 1.531 |
| 2 | Creatinine | 1.195 | 0.015 | 0.257 |
| 3 | L-Valine/betaine | 1.195 | 0.015 | -0.544 |
| 4 | Acetylcarnitine | 1.658 | 0.001 | 1.669 |
| 5 | Nα-Acetyl-L-arginine | 1.297 | 0.008 | -0.350 |
| 6 | Hypoxanthine | 1.883 | 0.000 | 0.968 |
| 7 | 1-Methylguanine | 1.376 | 0.005 | 0.483 |
| 8 | Adipic acid | 1.534 | 0.001 | -0.627 |
| 9 | Xanthosine | 1.467 | 0.002 | 0.389 |
| 10 | Guanosine | 1.448 | 0.003 | 0.273 |
| 11 | 7-Methylxanthine | 1.489 | 0.002 | 1.922 |
| 12 | 2-Methylguanosine | 1.654 | 0.001 | 0.475 |
| 13 | Butyryl-L-carnitine | 1.499 | 0.002 | 0.560 |
| 14 | Gluconic acid | 1.391 | 0.004 | -0.733 |
| 15 | Xanthurenic acid | 1.351 | 0.006 | 0.485 |
| 16 | Kynurenic acid | 1.590 | 0.001 | 0.560 |
| 17 | Indole-3-carboxylic acid | 1.189 | 0.015 | 0.496 |
| 18 | 6β-hydroxytestosterone | 2.203 | 0.000 | 1.251 |
| 19 | Androstenedione | 1.500 | 0.002 | 0.779 |
| 20 | PGA2 methyl ester | 1.709 | 0.000 | 0.676 |
| 21 | Cortisol | 1.340 | 0.006 | 0.641 |
| 22 | Deoxycorticosterone | 1.770 | 0.000 | 0.841 |
| 23 | Corticosterone | 1.568 | 0.001 | 0.766 |
| 24 | Cortisone | 1.383 | 0.004 | 0.661 |
| 25 | Testosterone glucuronide | 1.838 | 0.000 | 0.844 |
| 26 | EPA | 1.208 | 0.014 | 0.714 |
| 27 | Decanoyl-L-carnitine | 1.592 | 0.001 | 1.101 |
| 28 | Androsterone | 2.276 | 0.000 | 0.918 |
| 29 | Eicosapentaenoic | 1.282 | 0.009 | -0.417 |
| Acid ethyl ester | ||||
| 30 | Ursodeoxycholic acid | 1.599 | 0.001 | 0.474 |
| ESI- | ||||
| 31 | Shikimate-3-phosphate | 1.195 | 0.020 | -0.344 |
| 32 | 2-keto-D-gluconic acid | 1.902 | 0.000 | -0.426 |
| 33 | α-D-glucose | 1.647 | 0.001 | -0.484 |
| 34 | Pyroglutamic acid | 1.545 | 0.002 | 0.334 |
| 35 | (S)-2-hydroxyglutarate | 1.299 | 0.011 | -0.579 |
| 36 | 2-Deoxy-D-ribose | 1.264 | 0.014 | -0.455 |
| 37 | 1-Methyluric acid | 1.181 | 0.022 | 0.870 |
| 38 | Salicyluric acid | 1.455 | 0.004 | -0.723 |
| 39 | Salicylic acid | 1.170 | 0.023 | -0.494 |
| 40 | Indoxylsulfuric acid | 1.829 | 0.000 | 0.646 |
| 41 | Ferulic acid 4-O-glucuronide | 2.046 | 0.000 | -2.303 |
| 42 | Caffeic acid 3-sulfate | 1.320 | 0.010 | -2.214 |
| 43 | 2,3-Dihydroxybenzoic acid | 1.857 | 0.000 | -1.004 |
| 44 | 3,3-Dimethylglutaric acid | 1.635 | 0.001 | -1.225 |
| 45 | Ferulic acid 4-sulfate | 1.695 | 0.001 | -1.779 |
| 46 | Deoxyinosine | 1.315 | 0.010 | -1.049 |
| 47 | Indolelactic acid | 1.251 | 0.015 | -0.868 |
| 48 | 3-Methylsuberic acid | 1.577 | 0.002 | -1.825 |
| 49 | L-Homocitrulline | 1.619 | 0.001 | -1.883 |
| 50 | Glycocholic acid | 1.187 | 0.021 | 0.408 |
| 51 | Glycoursodeoxycholic acid | 1.392 | 0.006 | 0.932 |
| 52 | L-homotyrosine | 1.475 | 0.004 | -0.625 |
| 53 | Ethisterone | 1.702 | 0.001 | -0.659 |
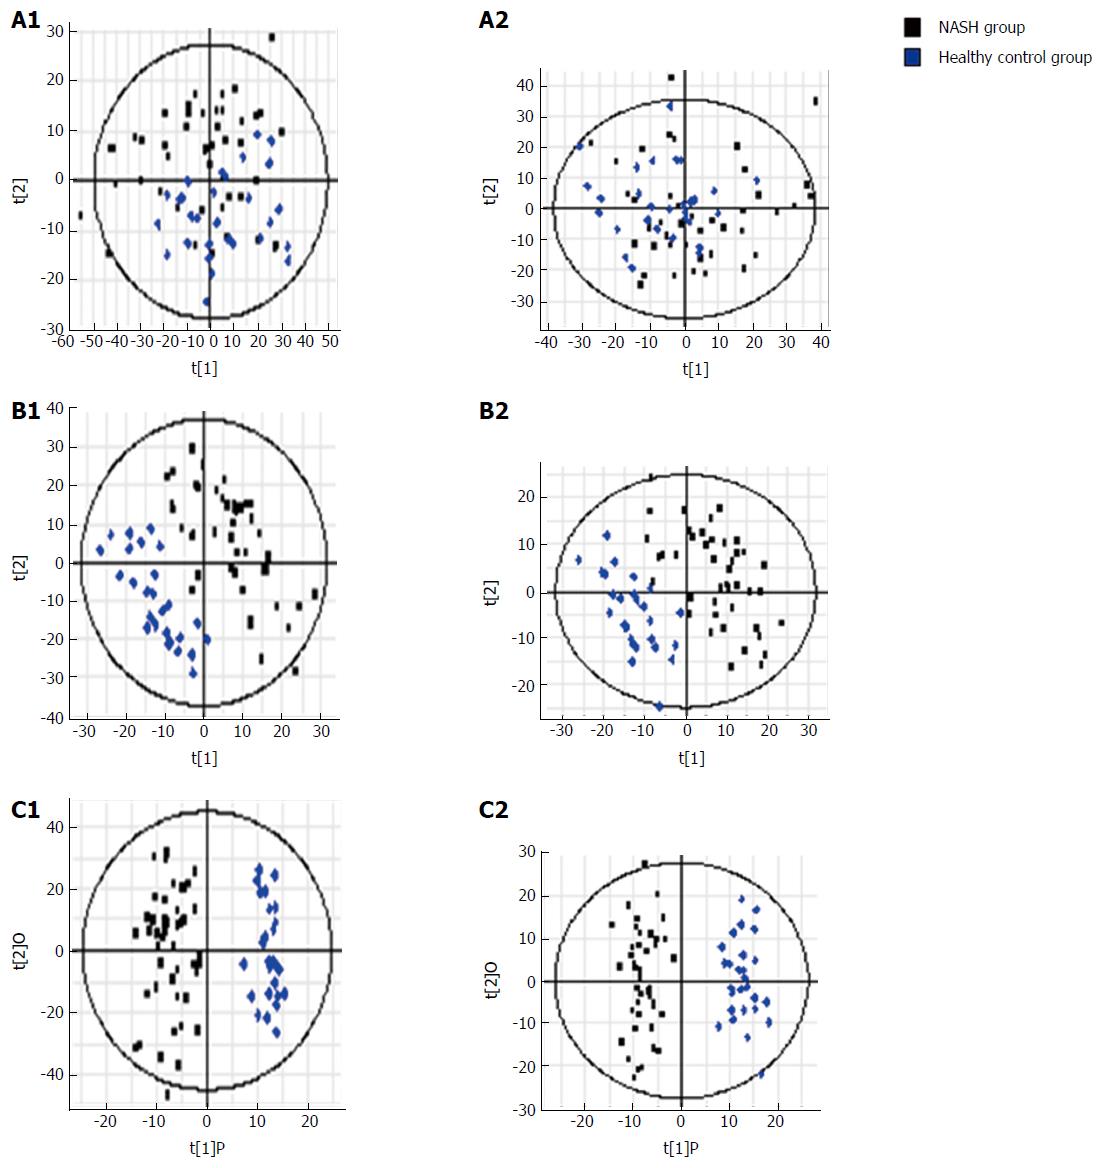
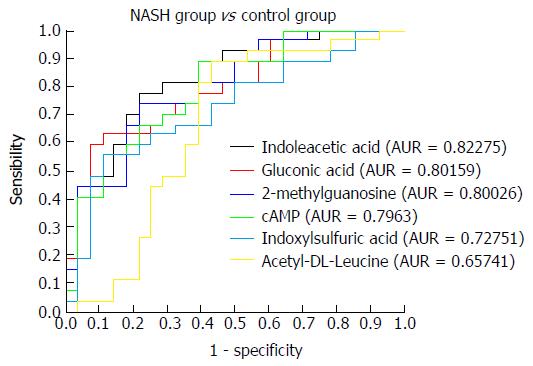
NASH group vs control group: Urinary metabonomics were also used to assess differences between the NASH and control groups. PCA analysis showed obvious spectral separation between the two groups, indicative of significant metabolic differences between NASH patients and healthy controls. This was further supported by PLS-DA and OPLS-DA (Figure 6). After filtering out the interference signals, 88 different metabolites (Table 4) were detected, consisting mainly of amino acids and their metabolic intermediates. Compared with the healthy controls, patients with NASH had much higher urinary levels of lysine, valine, citrulline, arginine, threonine, tyrosine, leucine, hippuric acid, and 3-indoleacetic acid, and lower levels of derivatives of indole acetic acid, such as 5-hydroxy indole acetic acid and indole-3-formic acid. In addition, cortisol levels decreased significantly. ROC analysis showed that 2-methylguanosine, gluconic acid, indoxylsulfuric acid, cAMP, indolelactic acid, and acetyl-DL-leucine could distinguish patients with NASH from healthy individuals (Figure 7).
| No. | Metabolites | VIP-value (OPLS-DA) | P value (t-test) | Fold change |
| E | ||||
| ESI+ | ||||
| 1 | L-Lysine | 1.291 | 0.007 | -0.747 |
| 2 | Suberic acid | 1.037 | 0.032 | -0.370 |
| 3 | L-Carnitine | 1.015 | 0.036 | 0.804 |
| 4 | Creatinine | 1.052 | 0.030 | 0.206 |
| 5 | L-Valine/betaine | 1.668 | 0.000 | -0.852 |
| 6 | Citrulline | 1.539 | 0.001 | -0.451 |
| 7 | L-Dopa | 1.249 | 0.009 | -0.322 |
| 8 | Acetylcarnitine | 1.213 | 0.012 | 0.971 |
| 9 | Nα-Acetyl-L-arginine | 1.128 | 0.019 | -0.658 |
| 10 | L-Threonine | 1.009 | 0.037 | -0.300 |
| 11 | L-Tyrosine | 1.217 | 0.011 | -0.304 |
| 12 | Uridine | 1.106 | 0.022 | 0.114 |
| 13 | Hypoxanthine | 2.406 | 0.000 | 1.093 |
| 14 | 2'-O-Methyladenosine | 1.345 | 0.005 | 0.222 |
| 15 | 1-Methylguanine | 1.921 | 0.000 | 0.744 |
| 16 | 6-Hydroxynicotinic acid | 1.617 | 0.001 | -0.957 |
| 17 | Adipic acid | 1.635 | 0.001 | -0.808 |
| 18 | Glycerophosphocholine | 1.623 | 0.001 | 0.299 |
| 19 | cAMP | 2.233 | 0.000 | 0.417 |
| 20 | L-Proline | 1.046 | 0.031 | 0.397 |
| 21 | Dimethyl fumarate | 1.716 | 0.000 | -0.627 |
| 22 | 5-Hydroxy-L-tryptophan | 1.118 | 0.021 | 0.190 |
| 23 | Xanthosine | 1.467 | 0.002 | 0.318 |
| 24 | D-Ribose | 0.994 | 0.040 | 0.141 |
| 25 | 2-Methylguanosine | 2.145 | 0.000 | 0.528 |
| 26 | Butyryl-L-carnitine | 1.941 | 0.000 | 0.569 |
| 27 | α-Hydroxyhippuric acid | 1.134 | 0.019 | -0.540 |
| 28 | Gluconic acid | 1.098 | 0.023 | -0.537 |
| 29 | N-Acetylproline | 1.486 | 0.002 | 0.491 |
| 30 | Kynurenic acid | 1.543 | 0.001 | 0.465 |
| 31 | Indoxylsulfuric acid | 1.444 | 0.002 | 0.494 |
| 32 | Ferulic acid | 0.982 | 0.043 | -0.948 |
| 33 | 5-Hydroxyindoleacetic acid | 1.420 | 0.003 | 0.312 |
| 34 | Acetyl-DL-leucine | 1.419 | 0.003 | -0.522 |
| 35 | Indole-3-carboxylic acid | 0.969 | 0.046 | 0.359 |
| 36 | 3-Indoleacetic acid | 1.055 | 0.029 | -0.458 |
| 37 | 6β-Hydroxytestosterone | 2.074 | 0.000 | 0.929 |
| 38 | Estrone glucuronide | 1.111 | 0.021 | -1.448 |
| 39 | PGA2 methyl ester | 1.305 | 0.006 | 0.389 |
| 40 | Cortisol | 1.864 | 0.000 | 0.658 |
| 41 | Tetrahydrocortisone | 1.173 | 0.015 | 0.412 |
| 42 | Corticosterone | 1.165 | 0.016 | 0.406 |
| 43 | Deoxycorticosterone | 1.502 | 0.002 | 0.551 |
| 44 | Cortisone | 1.444 | 0.002 | 0.633 |
| 45 | Ethisterone | 1.541 | 0.001 | 0.689 |
| 46 | EPA | 0.953 | 0.050 | 0.456 |
| 47 | Decanoyl-L-carnitine | 1.295 | 0.007 | 0.828 |
| 48 | Androsterone | 2.370 | 0.000 | 0.741 |
| 49 | Lauroylcarnitine | 1.455 | 0.002 | 0.700 |
| 50 | Palmitic amide | 1.277 | 0.008 | 0.674 |
| 51 | Stearamide | 1.655 | 0.000 | 1.008 |
| 52 | Ursodeoxycholic acid | 1.231 | 0.010 | 0.398 |
| ESI- | ||||
| 53 | N-Acetylneuraminic acid | 0.993 | 0.034 | -0.257 |
| 54 | 5-aminosalicylic acid | 2.042 | 0.000 | -0.877 |
| 55 | Guanine | 1.082 | 0.021 | -0.369 |
| 56 | p-Coumaric acid | 1.315 | 0.004 | -0.852 |
| 57 | 2-Keto-glutaramic acid | 1.058 | 0.024 | 0.201 |
| 58 | L-2-Aminoadipic acid | 0.968 | 0.039 | 0.265 |
| 59 | N-Acetyl-L-glutamic acid | 1.046 | 0.026 | 0.248 |
| 60 | Pyroglutamic acid | 2.089 | 0.000 | 0.483 |
| 61 | 2-Deoxy-D-ribose | 1.040 | 0.026 | -0.672 |
| 62 | N-Acetylaspartylglutamic acid | 1.091 | 0.020 | 0.250 |
| 63 | (S)-2-Hydroxyglutarate | 1.512 | 0.001 | -0.754 |
| 64 | Vanillylmandelic acid | 1.065 | 0.023 | 0.269 |
| 65 | (S)-(-)-2-Hydroxyisocaproic acid | 1.449 | 0.002 | -0.487 |
| 66 | Salicyluric acid | 0.975 | 0.038 | -0.792 |
| 67 | 2-Phenylglycine | 0.943 | 0.045 | -0.829 |
| 68 | Succinylacetone | 0.973 | 0.038 | 0.405 |
| 69 | Veratric acid | 0.944 | 0.045 | -0.573 |
| 70 | Acetyl-DL-valine | 0.956 | 0.042 | 0.264 |
| 71 | Salicylic acid | 1.034 | 0.027 | -0.574 |
| 72 | Indoxylsulfuric acid | 1.573 | 0.001 | 0.542 |
| 73 | 2-Isopropylmalic acid | 0.934 | 0.047 | -0.817 |
| 74 | Caffeic acid 3-sulfate | 0.929 | 0.048 | -2.412 |
| 75 | Dihydroferulic acid 4-sulfate | 1.351 | 0.003 | -1.229 |
| 76 | Pyridoxal phosphate | 0.965 | 0.040 | -1.215 |
| 77 | 2,3-Dihydroxybenzoic acid | 1.702 | 0.000 | -1.477 |
| 78 | L-Glutamine | 1.070 | 0.022 | 0.288 |
| 79 | 3-Methyladipic acid | 1.838 | 0.000 | -1.158 |
| 80 | Ferulic acid 4-sulfate | 1.903 | 0.000 | -1.748 |
| 81 | Isoferulic acid 3-O-glucuronide | 1.438 | 0.002 | -2.353 |
| 82 | 2-Keto-D-gluconic acid | 1.594 | 0.000 | -0.890 |
| 83 | (±)-Propionylcarnitine | 1.639 | 0.000 | 0.816 |
| 84 | Indolelactic acid | 1.420 | 0.002 | 1.305 |
| 85 | 3-Methylsuberic acid | 1.460 | 0.001 | -1.358 |
| 86 | L-Homocitrulline | 1.484 | 0.001 | -1.419 |
| 87 | Androsterone sulfate | 1.735 | 0.000 | 0.680 |
| 88 | L-Homotyrosine | 1.384 | 0.003 | -0.464 |
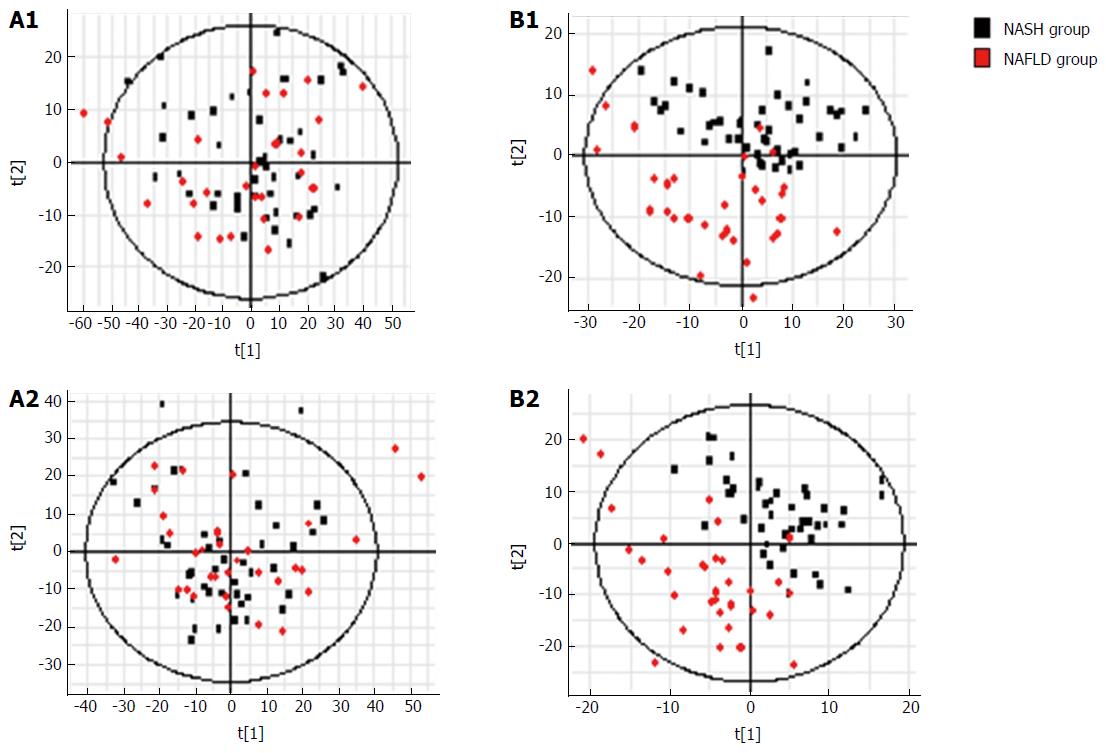
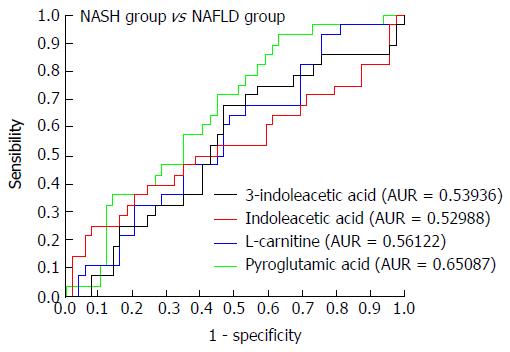
NAFLD group vs NASH group: Metabolic PCA analysis of urine samples from patients with NAFLD and NASH showed spectral separation between the two groups of samples, indicating significant metabolic differences. OPLS-DA was performed to better assess these differences (Figure 8). After filtering out interference signals, 31 different metabolites (Table 5) were detected, mainly nucleic acids and amino acids. Compared with the NAFLD group, patients with NASH had much higher concentrations of methyl xanthine, tryptophan, 3-indole acetic acid, and gluconic acid, and a lower level of proline. ROC analysis showed that 3-indoleacetic acid, L-carnitine, pyroglutamic acid, and indolelactic acid could distinguish NASH from NAFLD samples (Figure 9).
| No. | Metabolites | VIP-value (OPLS-DA) | P value (t-test) | Fold change |
| ESI+ | ||||
| 1 | L-Carnitine | 1.253 | 0.067 | -0.727 |
| 2 | L-Dopa | 0.952 | 0.092 | 0.234 |
| 3 | Acetylcarnitine | 1.181 | 0.094 | -0.698 |
| 4 | L-Histidine | 1.229 | 0.081 | -1.339 |
| 5 | Pyroglutamic acid | 1.541 | 0.021 | 0.143 |
| 6 | 3-Methylxanthine | 2.403 | 0.002 | -1.981 |
| 7 | α-D-Glucose | 1.739 | 0.013 | -1.376 |
| 8 | 5-Hydroxyferulate | 0.895 | 0.058 | -0.266 |
| 9 | 2-Oxosuberate | 0.850 | 0.073 | -0.315 |
| 10 | p-Hydroxyphenylacetic acid | 1.354 | 0.095 | 0.398 |
| 11 | 3-Indoleacetic Acid | 0.915 | 0.052 | -0.378 |
| 12 | β-Estradiol | 1.883 | 0.002 | -0.635 |
| 13 | Phosphorylcholine | 1.731 | 0.032 | 0.716 |
| 14 | 17α-Hydroxypregnenolone | 0.854 | 0.087 | -0.281 |
| 15 | Deoxycorticosterone | 0.865 | 0.093 | -0.312 |
| 16 | Progesterone | 0.866 | 0.084 | -0.301 |
| ESI- | ||||
| 17 | 2-Keto-glutaramic acid | 1.653 | 0.027 | 0.210 |
| 18 | cAMP | 1.659 | 0.041 | 0.196 |
| 19 | 7-Methylxanthine | 1.595 | 0.036 | -0.925 |
| 20 | (S)-(-)-2-Hydroxyisocaproic acid | 1.344 | 0.089 | -0.250 |
| 21 | Gluconic acid | 1.638 | 0.025 | -1.111 |
| 22 | N-Acetylproline | 1.865 | 0.021 | 0.399 |
| 23 | Acetyl-DL-valine | 1.636 | 0.053 | 0.284 |
| 24 | Pyridoxal phosphate | 1.490 | 0.050 | -0.990 |
| 25 | N-Acetyl-DL-tryptophan | 1.440 | 0.059 | -0.951 |
| 26 | 2-Keto-D-gluconic acid | 1.258 | 0.088 | -0.340 |
| 27 | D-(+)-3-Phenyllactic acid | 2.021 | 0.017 | -1.621 |
| 28 | Indoleactic acid | 1.495 | 0.051 | 0.832 |
| 29 | 3-Hydroxy-sebacic acid | 1.270 | 0.092 | -0.292 |
| 30 | Sebacic acid | 1.847 | 0.024 | 0.420 |
| 31 | Deoxyguanosine | 1.548 |
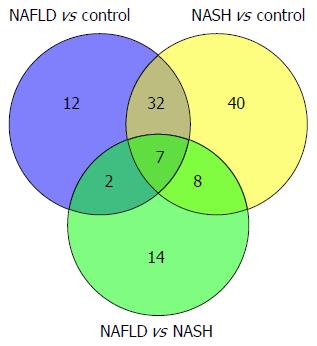
Key differential metabolites among the NAFLD, NASH, and control groups: The differentially expressed metabolites in the three pairwise comparisons were combined to determine the metabolites that overlapped in the three groups. Seven metabolites were screened through Venn analysis: L-carnitine, acetyl carnitine, gluconic acid, deoxycorticosterone, 2-keto-D-gluconic acid, pyroglutamic acid, and indolelactic acid (Figure 10). Kyoto Encyclopedia of Genes and genomes pathway analysis showed that these seven metabolites were enriched in seven pathways: metabolic pathways, the pentose phosphate pathway, antibiotic biosynthesis pathways antibiotics, steroid hormone biosynthesis, bile secretion, carbon metabolism, and glutathione metabolism. Three of these pathways, the pentose phosphate, carbon metabolism, and glutathione metabolism pathways, might be associated closely with the pathological processes of NAFLD and NASH.
Obesity, insulin resistance, and associated metabolic perturbations are observed frequently in patients with NAFLD[14,15]. NASH is a type of NAFLD with serious abnormalities in liver function[16]. NAFLD has a significant impact on health, affecting many body systems[17]. To determine the exact progress of NAFLD, we investigated the metabolic changes involved in NAFLD and NASH. Urinary metabolomics might provide a better understanding of the pathogenesis of NAFLD and reveal key markers that can differentiate between NAFLD from NASH.
In the NAFLD and control groups, the gender ratio showed no difference. While in the NASH group, there were more males than females, which might be because that more females visit their doctor earlier than males, and might not develop NASH, according to the doctor’s experience. Age and height were similar in the NAFLD, NASH, and control groups, whereas body weight and BMI were significantly higher in the NASH than in the NAFLD and control groups. These findings suggested a link between obesity and NASH. Parameters of liver function and blood lipids differed in patients with NASH and NAFLD, indicating that metabolic changes occurred during the progression of NAFLD to NASH. One of the overlapping differentially expressed metabolites, pyroglutamic acid, is involved in glutathione metabolism, a finding consistent with abnormal liver function. Another metabolite, L-carnitine, is involved in bile secretion, perhaps explaining the difference in blood lipid levels between the NAFLD and NASH groups.
Animal experiments have identified metabolic changes in mice with NAFLD or NASH[18]. For example, the concentrations of triglycerides, cholesterol, and intermediates of the methionine cycle were reported to be altered[19]. In addition, phospholipid and bile acid metabolism were disrupted[20] in mouse models of NASH.
Metabolic changes have also been detected in clinical trials. Serum glucose, lactate, glutamate/glutamine, and taurine concentrations were reported to differ between patients with NAFLD and healthy controls[21]. Bile acids and markers of glutathione, lipid, and amino acid metabolism were also observed to differ between NAFLD patients and controls[22]. The present study found differences in metabolites of amino acids and nucleic acids in NAFLD patients and controls, with the concentration of hypoxanthine being especially lower in patients with NAFLD. NAFLD is characterized by disorders in hypoxanthine and xanthine metabolism, which lead to lipid peroxidation and oxidative stress, producing increased amounts of free radicals[23]. Hypoxanthine and xanthine concentrations can be used to estimate the degree of injury to hepatocytes[24].
This study also showed that the concentration of carnitine in urine was much lower in NAFLD patients than in the healthy controls. Carnitine not only supplies energy for the oxidation of fatty acids[25], but also eliminates free radicals that can destabilize cell membranes[26]. Low carnitine concentrations can result in cell oxidative damage, and fatty acid synthesis and energy metabolism disorders[27-29], ultimately resulting in NAFLD.
The concentrations of amino acids and their metabolic intermediates were generally higher in patients with NASH patients than in healthy individuals. Most amino acids are synthesized and degraded in the liver; thus, injury to the liver can result in abnormalities in the metabolism of amino acids and the release of amino acids from hepatocytes[30]. Thus, amino acid levels will be higher in the urine of NASH patients than in healthy controls. We also found that cortisol concentrations were significantly lower in the urine of NASH patients compared with that in the controls, indicating possible neuroendocrine changes in NASH patients. Cortisol concentrations have been reported to correlate with the severity of NAFLD[31].
Comparisons between the groups of patients with NAFLD and NASH showed that most of the differentially expressed metabolites were nucleic acids and amino acids. The level of cholinesterase was significantly lower in patients with NASH than with NAFLD. Low levels of cholinesterase will have negative effects on the synthesis and secretion of very low-density lipoprotein (VLDL). This can result in an inability to transport TG out of hepatocytes, which can result in liver steatosis[32,33]. Deposits of excess fat can cause lipid peroxidation and damage to the antioxidant barrier[25,26], an important step by which NASH develops from NAFLD[34]. Interestingly, we also found that the level of indoleacetic acid was much higher in the NASH group compared with that in the NAFLD group. This was consistent with findings showing that the indoleacetic acid concentration correlates with liver damage[35].
The alterations observed in the NAFLD and NASH groups mainly affect energy[19]. Differential levels of hormones, cytokines, and neurotransmitters may result in abnormal energy metabolism in patients with NAFLD[36], which is consistent with our results. Alterations in hepatic mitochondrial function in NAFLD patients might influence lipid metabolism and promote oxidative stress[37], eventually resulting in changes in metabolites. Pathway analysis of the overlapping metabolites indicated that amino acid metabolism and pentose phosphate pathways might be involved in the progression of NAFLD to NASH. Alterations in amino acid metabolites represent adaptive physiological responses to hepatic stress in patients with NASH[38]. Glycometabolism, including the pentose phosphate pathway, might be altered, inasmuch as insulin resistance is one of the primary causes of NAFLD[39]. Many of these compounds might be associated with biochemical perturbations associated with liver dysfunction and inflammation[40]. The alterations in metabonomics we observed were consistent with previously reported changes in biochemical parameters.
Statistical analysis identified a panel of biomarkers involved in energy metabolism, amino acid metabolism, and glycometabolism, which might provide clues to the potential mechanism involved in the progress from NAFLD to NASH. These biomarkers could be used to distinguish between NAFLD from NASH effectively. These biomarkers might be diagnostic for NASH and could act as indicators of the efficacy of therapeutic interventions.
Nonalcoholic fatty liver disease (NAFLD) comprises a spectrum of pathological conditions, including simple steatosis, nonalcoholic steatohepatitis (NASH), and cirrhosis. The prevalence of NAFLD is linked strongly to obesity, insulin resistance, and a cluster of metabolic disorders, including hypertriglyceridemia and hyperuricemia, which impair health seriously. No standard treatment exists currently to manage NAFLD, or even NASH. Identification of metabolic differences among stages of NAFLD might result in the development of more effective and specific treatments for NAFLD and NASH. This study was designed to investigate correlations between disease stages and urine metabonomics in patients with NAFLD, specifically to determine whether urine metabonomics could be used to distinguish NAFLD from NASH, which would aid the diagnosis and treatment of NAFLD.
A panel of biomarkers that can distinguish between NAFLD and NASH and can help to determine the molecular mechanism involved in the process of development of NASH from NAFLD was developed. Urinary biomarkers may be diagnostic in these patients and might be used to assess responses to therapeutic interventions.
Metabolic changes have been detected in clinical trials. Serum glucose, lactate, glutamate/glutamine, taurine concentrations, bile acids, markers of glutathione, lipids, and amino acid metabolism have been reported to differ between patients with NAFLD and healthy controls. Among those findings, low carnitine concentrations could result in cell oxidative damage, fatty acid synthesis, and energy metabolism disorders, ultimately resulting in NAFLD. Cortisol concentrations have been reported to correlate with the severity of NAFLD and indole acetic acid concentration correlates with liver damage. Differential levels of hormones, cytokines, and neurotransmitters might result in abnormal energy metabolism in patients with NAFLD.
The urinary biomarkers found in this study might be diagnostic in these patients and could be used for diagnose and to evaluate the treatment of NAFLD.
NAFLD means nonalcoholic fatty liver disease. In our study, patients with NAFLD refers to those patients that were diagnosed using B ultrasound and their liver functions were normal. NASH means nonalcoholic steatohepatitis. In our study, patients with NASH refers to those patients that were diagnosed using B ultrasound and their liver functions were abnormal. Principal component analysis means principal component analysis. Partial least squares discriminant analysis refers to partial least squares-discriminate analysis. Orthogonal projections to latent structures-discriminant analysis is orthogonal projections to latent structures discriminant analysis. All these analyses were used to distinguish different groups of patients or controls.
This article investigated urinary biomarkers to distinguish NAFLD from NASH, which could help to determine the molecular mechanism involved in the process of developing NASH from NAFLD and improve the diagnosis and treatment of NAFLD. Not only the results, but also the methods will be attractive for readers.
Manuscript source: Unsolicited manuscript
Specialty type: Gastroenterology and hepatology
Country of origin: China
Peer-review report classification
Grade A (Excellent): 0
Grade B (Very good): B, B
Grade C (Good): 0
Grade D (Fair): 0
Grade E (Poor): 0
P- Reviewer: Lee HC, Miura K S- Editor: Ma YJ L- Editor: Stewart G E- Editor: Zhang FF
| 1. | Vernon G, Baranova A, Younossi ZM. Systematic review: the epidemiology and natural history of non-alcoholic fatty liver disease and non-alcoholic steatohepatitis in adults. Aliment Pharmacol Ther. 2011;34:274-285. [PubMed] [DOI] [Cited in This Article: ] [Cited by in Crossref: 2065] [Cited by in F6Publishing: 2143] [Article Influence: 164.8] [Reference Citation Analysis (0)] |
| 2. | Forbes S, Taylor-Robinson SD, Patel N, Allan P, Walker BR, Johnston DG. Increased prevalence of non-alcoholic fatty liver disease in European women with a history of gestational diabetes. Diabetologia. 2011;54:641-647. [PubMed] [DOI] [Cited in This Article: ] [Cited by in Crossref: 48] [Cited by in F6Publishing: 40] [Article Influence: 3.1] [Reference Citation Analysis (0)] |
| 3. | Choi SS, Diehl AM. Hepatic triglyceride synthesis and nonalcoholic fatty liver disease. Curr Opin Lipidol. 2008;19:295-300. [PubMed] [DOI] [Cited in This Article: ] [Cited by in Crossref: 181] [Cited by in F6Publishing: 189] [Article Influence: 11.8] [Reference Citation Analysis (0)] |
| 4. | de Wit NJ, Afman LA, Mensink M, Müller M. Phenotyping the effect of diet on non-alcoholic fatty liver disease. J Hepatol. 2012;57:1370-1373. [PubMed] [DOI] [Cited in This Article: ] [Cited by in Crossref: 111] [Cited by in F6Publishing: 114] [Article Influence: 9.5] [Reference Citation Analysis (0)] |
| 5. | Schwenger KJ, Allard JP. Clinical approaches to non-alcoholic fatty liver disease. World J Gastroenterol. 2014;20:1712-1723. [PubMed] [DOI] [Cited in This Article: ] [Cited by in CrossRef: 89] [Cited by in F6Publishing: 84] [Article Influence: 8.4] [Reference Citation Analysis (0)] |
| 6. | Farrell GC, Larter CZ. Nonalcoholic fatty liver disease: from steatosis to cirrhosis. Hepatology. 2006;43:S99-S112. [PubMed] [DOI] [Cited in This Article: ] [Cited by in Crossref: 1756] [Cited by in F6Publishing: 1769] [Article Influence: 98.3] [Reference Citation Analysis (0)] |
| 7. | Dixon JB, Bhathal PS, Hughes NR, O’Brien PE. Nonalcoholic fatty liver disease: Improvement in liver histological analysis with weight loss. Hepatology. 2004;39:1647-1654. [PubMed] [DOI] [Cited in This Article: ] [Cited by in Crossref: 558] [Cited by in F6Publishing: 502] [Article Influence: 25.1] [Reference Citation Analysis (0)] |
| 8. | Klein S, Mittendorfer B, Eagon JC, Patterson B, Grant L, Feirt N, Seki E, Brenner D, Korenblat K, McCrea J. Gastric bypass surgery improves metabolic and hepatic abnormalities associated with nonalcoholic fatty liver disease. Gastroenterology. 2006;130:1564-1572. [PubMed] [DOI] [Cited in This Article: ] [Cited by in Crossref: 221] [Cited by in F6Publishing: 230] [Article Influence: 12.8] [Reference Citation Analysis (0)] |
| 9. | van Ginneken V, Verhey E, Poelmann R, Ramakers R, van Dijk KW, Ham L, Voshol P, Havekes L, Van Eck M, van der Greef J. Metabolomics (liver and blood profiling) in a mouse model in response to fasting: a study of hepatic steatosis. Biochim Biophys Acta. 2007;1771:1263-1270. [PubMed] [DOI] [Cited in This Article: ] [Cited by in Crossref: 59] [Cited by in F6Publishing: 58] [Article Influence: 3.4] [Reference Citation Analysis (0)] |
| 10. | Beyoğlu D, Idle JR. The metabolomic window into hepatobiliary disease. J Hepatol. 2013;59:842-858. [PubMed] [DOI] [Cited in This Article: ] [Cited by in Crossref: 157] [Cited by in F6Publishing: 165] [Article Influence: 15.0] [Reference Citation Analysis (0)] |
| 11. | Hashimoto E, Tokushige K, Ludwig J. Diagnosis and classification of non-alcoholic fatty liver disease and non-alcoholic steatohepatitis: Current concepts and remaining challenges. Hepatol Res. 2015;45:20-28. [PubMed] [DOI] [Cited in This Article: ] [Cited by in Crossref: 65] [Cited by in F6Publishing: 69] [Article Influence: 7.7] [Reference Citation Analysis (0)] |
| 12. | Yang R, Dong J, Guo H, Li H, Wang S, Zhao H, Zhou W, Yu S, Wang M, Chen W. Rapid and precise measurement of serum branched-chain and aromatic amino acids by isotope dilution liquid chromatography tandem mass spectrometry. PLoS One. 2013;8:e81144. [PubMed] [DOI] [Cited in This Article: ] [Cited by in Crossref: 28] [Cited by in F6Publishing: 27] [Article Influence: 2.5] [Reference Citation Analysis (0)] |
| 13. | Cheng J, Joyce A, Yates K, Aouizerat B, Sanyal AJ. Metabolomic profiling to identify predictors of response to vitamin E for non-alcoholic steatohepatitis (NASH). PLoS One. 2012;7:e44106. [PubMed] [DOI] [Cited in This Article: ] [Cited by in Crossref: 38] [Cited by in F6Publishing: 40] [Article Influence: 3.3] [Reference Citation Analysis (0)] |
| 14. | Preiss D, Sattar N. Non-alcoholic fatty liver disease: an overview of prevalence, diagnosis, pathogenesis and treatment considerations. Clin Sci (Lond). 2008;115:141-150. [PubMed] [DOI] [Cited in This Article: ] [Cited by in Crossref: 206] [Cited by in F6Publishing: 215] [Article Influence: 13.4] [Reference Citation Analysis (0)] |
| 15. | Angulo P. Nonalcoholic fatty liver disease. N Engl J Med. 2002;346:1221-1231. [PubMed] [DOI] [Cited in This Article: ] [Cited by in Crossref: 3655] [Cited by in F6Publishing: 3609] [Article Influence: 164.0] [Reference Citation Analysis (2)] |
| 16. | Nguyen TA, Sanyal AJ. Pathophysiology guided treatment of nonalcoholic steatohepatitis. J Gastroenterol Hepatol. 2012;27 Suppl 2:58-64. [PubMed] [DOI] [Cited in This Article: ] [Cited by in Crossref: 22] [Cited by in F6Publishing: 22] [Article Influence: 1.8] [Reference Citation Analysis (0)] |
| 17. | Caballería L, Auladell MA, Torán P, Miranda D, Aznar J, Pera G, Gil D, Muñoz L, Planas J, Canut S. Prevalence and factors associated with the presence of non alcoholic fatty liver disease in an apparently healthy adult population in primary care units. BMC Gastroenterol. 2007;7:41. [PubMed] [DOI] [Cited in This Article: ] [Cited by in Crossref: 30] [Cited by in F6Publishing: 32] [Article Influence: 1.9] [Reference Citation Analysis (0)] |
| 18. | Shi X, Wahlang B, Wei X, Yin X, Falkner KC, Prough RA, Kim SH, Mueller EG, McClain CJ, Cave M. Metabolomic analysis of the effects of polychlorinated biphenyls in nonalcoholic fatty liver disease. J Proteome Res. 2012;11:3805-3815. [PubMed] [DOI] [Cited in This Article: ] [Cited by in Crossref: 48] [Cited by in F6Publishing: 46] [Article Influence: 3.8] [Reference Citation Analysis (0)] |
| 19. | Thomas A, Stevens AP, Klein MS, Hellerbrand C, Dettmer K, Gronwald W, Oefner PJ, Reinders J. Early changes in the liver-soluble proteome from mice fed a nonalcoholic steatohepatitis inducing diet. Proteomics. 2012;12:1437-1451. [PubMed] [DOI] [Cited in This Article: ] [Cited by in Crossref: 18] [Cited by in F6Publishing: 20] [Article Influence: 1.7] [Reference Citation Analysis (0)] |
| 20. | Tanaka N, Matsubara T, Krausz KW, Patterson AD, Gonzalez FJ. Disruption of phospholipid and bile acid homeostasis in mice with nonalcoholic steatohepatitis. Hepatology. 2012;56:118-129. [PubMed] [DOI] [Cited in This Article: ] [Cited by in Crossref: 182] [Cited by in F6Publishing: 201] [Article Influence: 16.8] [Reference Citation Analysis (0)] |
| 21. | Li H, Wang L, Yan X, Liu Q, Yu C, Wei H, Li Y, Zhang X, He F, Jiang Y. A proton nuclear magnetic resonance metabonomics approach for biomarker discovery in nonalcoholic fatty liver disease. J Proteome Res. 2011;10:2797-2806. [PubMed] [DOI] [Cited in This Article: ] [Cited by in Crossref: 51] [Cited by in F6Publishing: 54] [Article Influence: 4.2] [Reference Citation Analysis (0)] |
| 22. | Kalhan SC, Guo L, Edmison J, Dasarathy S, McCullough AJ, Hanson RW, Milburn M. Plasma metabolomic profile in nonalcoholic fatty liver disease. Metabolism. 2011;60:404-413. [PubMed] [DOI] [Cited in This Article: ] [Cited by in Crossref: 358] [Cited by in F6Publishing: 368] [Article Influence: 28.3] [Reference Citation Analysis (0)] |
| 23. | Morita M, Ishida N, Uchiyama K, Yamaguchi K, Itoh Y, Shichiri M, Yoshida Y, Hagihara Y, Naito Y, Yoshikawa T. Fatty liver induced by free radicals and lipid peroxidation. Free Radic Res. 2012;46:758-765. [PubMed] [DOI] [Cited in This Article: ] [Cited by in Crossref: 47] [Cited by in F6Publishing: 51] [Article Influence: 4.3] [Reference Citation Analysis (0)] |
| 24. | Vincent MF, Van den Berghe G, Hers HG. Metabolism of hypoxanthine in isolated rat hepatocytes. Biochem J. 1984;222:145-155. [PubMed] [Cited in This Article: ] |
| 25. | Matera M, Bellinghieri G, Costantino G, Santoro D, Calvani M, Savica V. History of L-carnitine: implications for renal disease. J Ren Nutr. 2003;13:2-14. [PubMed] [Cited in This Article: ] |
| 26. | Dubinina EE. [The role of reactive oxygen species as signal molecules in tissue metabolism in oxidative stress]. Vopr Med Khim. 2001;47:561-581. [PubMed] [Cited in This Article: ] |
| 27. | Jia W, Liu XS, Zhu Y, Li Q, Han WN, Zhang Y, Zhang JS, Yang K, Zhang XH, Jin BQ. Preparation and characterization of mabs against different epitopes of CD226 (PTA1). Hybridoma. 2000;19:489-494. [PubMed] [DOI] [Cited in This Article: ] [Cited by in Crossref: 18] [Cited by in F6Publishing: 18] [Article Influence: 0.8] [Reference Citation Analysis (0)] |
| 28. | Ishikawa H, Takaki A, Tsuzaki R, Yasunaka T, Koike K, Shimomura Y, Seki H, Matsushita H, Miyake Y, Ikeda F. L-carnitine prevents progression of non-alcoholic steatohepatitis in a mouse model with upregulation of mitochondrial pathway. PLoS One. 2014;9:e100627. [PubMed] [DOI] [Cited in This Article: ] [Cited by in Crossref: 50] [Cited by in F6Publishing: 55] [Article Influence: 5.5] [Reference Citation Analysis (0)] |
| 29. | Jun DW, Cho WK, Jun JH, Kwon HJ, Jang KS, Kim HJ, Jeon HJ, Lee KN, Lee HL, Lee OY. Prevention of free fatty acid-induced hepatic lipotoxicity by carnitine via reversal of mitochondrial dysfunction. Liver Int. 2011;31:1315-1324. [PubMed] [DOI] [Cited in This Article: ] [Cited by in Crossref: 36] [Cited by in F6Publishing: 38] [Article Influence: 2.9] [Reference Citation Analysis (0)] |
| 30. | Munro HN, Fernstrom JD, Wurtman RJ. Insulin, plasma aminoacid imbalance, and hepatic coma. Lancet. 1975;1:722-724. [PubMed] [Cited in This Article: ] |
| 31. | Arabi YM, Aljumah A, Dabbagh O, Tamim HM, Rishu AH, Al-Abdulkareem A, Knawy BA, Hajeer AH, Tamimi W, Cherfan A. Low-dose hydrocortisone in patients with cirrhosis and septic shock: a randomized controlled trial. CMAJ. 2010;182:1971-1977. [PubMed] [DOI] [Cited in This Article: ] [Cited by in Crossref: 140] [Cited by in F6Publishing: 139] [Article Influence: 9.9] [Reference Citation Analysis (0)] |
| 32. | Vance JE, Vance DE. The role of phosphatidylcholine biosynthesis in the secretion of lipoproteins from hepatocytes. Can J Biochem Cell Biol. 1985;63:870-881. [PubMed] [DOI] [Cited in This Article: ] [Cited by in Crossref: 89] [Cited by in F6Publishing: 93] [Article Influence: 2.4] [Reference Citation Analysis (0)] |
| 33. | Yao ZM, Vance DE. The active synthesis of phosphatidylcholine is required for very low density lipoprotein secretion from rat hepatocytes. J Biol Chem. 1988;263:2998-3004. [PubMed] [Cited in This Article: ] |
| 34. | Reid AE. Nonalcoholic steatohepatitis. Gastroenterology. 2001;121:710-723. [PubMed] [Cited in This Article: ] |
| 35. | Tarantino G, Savastano S, Colao A, Polichetti G, Capone D. Urinary excretion of 5-hydroxy-3-indoleacetic acid in dystimic/depressed, adult obese women: what correlations to hepatic steatosis? Int J Immunopathol Pharmacol. 2011;24:769-779. [PubMed] [Cited in This Article: ] |
| 36. | Mehta R, Birerdinc A, Wang L, Younoszai Z, Moazzez A, Elariny H, Goodman Z, Chandhoke V, Baranova A, Younossi ZM. Expression of energy metabolism related genes in the gastric tissue of obese individuals with non-alcoholic fatty liver disease. BMC Gastroenterol. 2014;14:72. [PubMed] [DOI] [Cited in This Article: ] [Cited by in Crossref: 4] [Cited by in F6Publishing: 7] [Article Influence: 0.7] [Reference Citation Analysis (0)] |
| 37. | Koliaki C, Roden M. Hepatic energy metabolism in human diabetes mellitus, obesity and non-alcoholic fatty liver disease. Mol Cell Endocrinol. 2013;379:35-42. [PubMed] [DOI] [Cited in This Article: ] [Cited by in Crossref: 82] [Cited by in F6Publishing: 88] [Article Influence: 8.0] [Reference Citation Analysis (0)] |
| 38. | Lake AD, Novak P, Shipkova P, Aranibar N, Robertson DG, Reily MD, Lehman-McKeeman LD, Vaillancourt RR, Cherrington NJ. Branched chain amino acid metabolism profiles in progressive human nonalcoholic fatty liver disease. Amino Acids. 2015;47:603-615. [PubMed] [DOI] [Cited in This Article: ] [Cited by in Crossref: 168] [Cited by in F6Publishing: 151] [Article Influence: 16.8] [Reference Citation Analysis (0)] |
| 39. | Su AP, Cao SS, Le Tian B, Da Zhang Z, Hu WM, Zhang Y, Wang ZL, Babu SR, Hu T. Effect of transjugular intrahepatic portosystemic shunt on glycometabolism in cirrhosis patients. Clin Res Hepatol Gastroenterol. 2012;36:53-59. [PubMed] [DOI] [Cited in This Article: ] [Cited by in Crossref: 10] [Cited by in F6Publishing: 11] [Article Influence: 0.9] [Reference Citation Analysis (0)] |
| 40. | Barr J, Vázquez-Chantada M, Alonso C, Pérez-Cormenzana M, Mayo R, Galán A, Caballería J, Martín-Duce A, Tran A, Wagner C. Liquid chromatography-mass spectrometry-based parallel metabolic profiling of human and mouse model serum reveals putative biomarkers associated with the progression of nonalcoholic fatty liver disease. J Proteome Res. 2010;9:4501-4512. [PubMed] [DOI] [Cited in This Article: ] [Cited by in Crossref: 118] [Cited by in F6Publishing: 126] [Article Influence: 9.7] [Reference Citation Analysis (0)] |


