Copyright
©The Author(s) 2016.
World J Gastroenterol. Dec 21, 2016; 22(47): 10465-10470
Published online Dec 21, 2016. doi: 10.3748/wjg.v22.i47.10465
Published online Dec 21, 2016. doi: 10.3748/wjg.v22.i47.10465
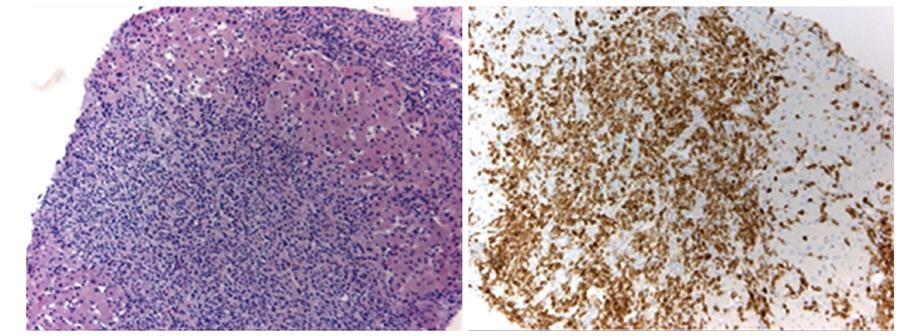
Figure 2 Liver biopsy showing hepatosplenic T-cell lymphoma.
Left: Hematoxylin and eosin staining (magnification × 100) showing intrasinusoidal and portal infiltration of atypical lymphocytes; Right: CD3 staining (magnification × 100) showing neoplastic cells (appearing in brown colour).
- Citation: van de Meeberg MM, Derikx LAAP, Sinnige HAM, Nooijen P, Schipper DL, Nissen LHC. Hepatosplenic T-cell lymphoma in a 47-year-old Crohn’s disease patient on thiopurine monotherapy. World J Gastroenterol 2016; 22(47): 10465-10470
- URL: https://www.wjgnet.com/1007-9327/full/v22/i47/10465.htm
- DOI: https://dx.doi.org/10.3748/wjg.v22.i47.10465


