Copyright
©The Author(s) 2015.
World J Gastroenterol. Jul 7, 2015; 21(25): 7814-7823
Published online Jul 7, 2015. doi: 10.3748/wjg.v21.i25.7814
Published online Jul 7, 2015. doi: 10.3748/wjg.v21.i25.7814
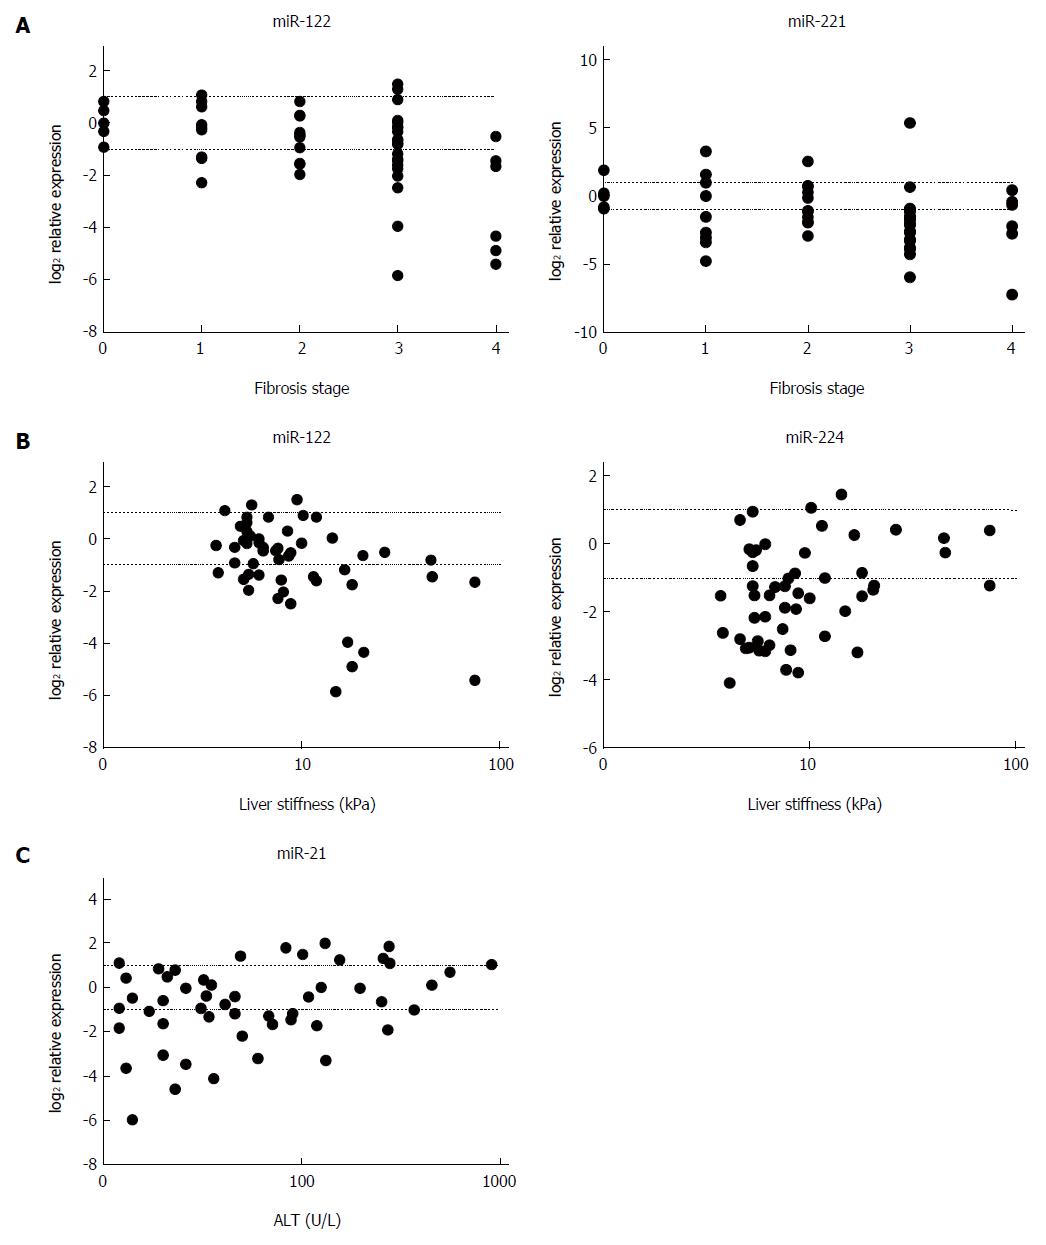
Figure 3 Correlation of miRNA expression with fibrosis stage, liver stiffness (measured by transient elastography), and alanine aminotransferase levels.
A: The negative correlation of miR-122 (r = -0.4; P < 0.01) and miR-221 (r = -0.3; P < 0.03) with fibrosis stage; B: The negative correlation of miR-122 (r = -0.4; P < 0.01) and positive correlation of miR-224 (r = 0.3; P < 0.04) with liver stiffness; C: The positive correlation of miR-21 (r = 0.3; P < 0.04) with serum alanine aminotransferase (ALT) levels. The upper dotted lines indicate twofold elevation in expression; the lower dotted lines signify a one-half reduction of expression.
- Citation: Halász T, Horváth G, Pár G, Werling K, Kiss A, Schaff Z, Lendvai G. miR-122 negatively correlates with liver fibrosis as detected by histology and FibroScan. World J Gastroenterol 2015; 21(25): 7814-7823
- URL: https://www.wjgnet.com/1007-9327/full/v21/i25/7814.htm
- DOI: https://dx.doi.org/10.3748/wjg.v21.i25.7814


