Copyright
©The Author(s) 2015.
World J Gastroenterol. Apr 28, 2015; 21(16): 4894-4902
Published online Apr 28, 2015. doi: 10.3748/wjg.v21.i16.4894
Published online Apr 28, 2015. doi: 10.3748/wjg.v21.i16.4894
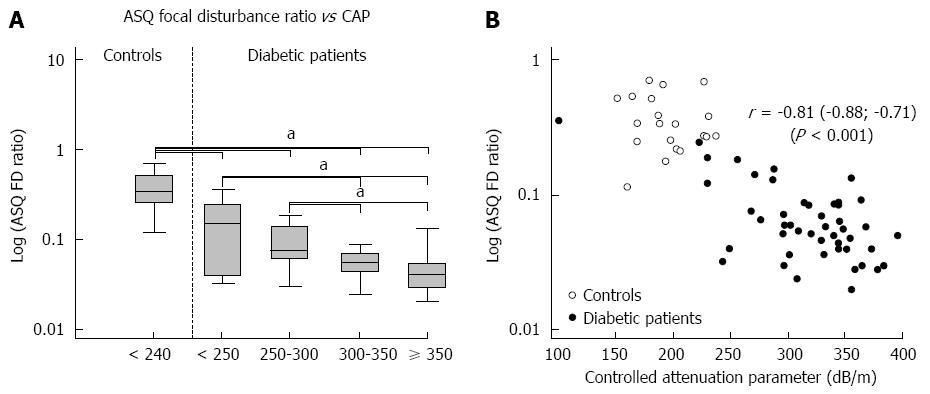
Figure 3 Correlation of acoustic structure quantification focal disturbance ratio and controlled attenuation parameter values in healthy controls and diabetic patients.
Acoustic structure quantification (ASQ) focal disturbance (FD) ratio decreased in patients with advanced steatosis compared with healthy controls and patients with mild steatosis (aP < 0.05, vs control, Kruskal-Wallis test) (A). Logarithmic ASQ values correlated strongly with controlled attenuation parameter (CAP) values (B).
- Citation: Karlas T, Berger J, Garnov N, Lindner F, Busse H, Linder N, Schaudinn A, Relke B, Chakaroun R, Tröltzsch M, Wiegand J, Keim V. Estimating steatosis and fibrosis: Comparison of acoustic structure quantification with established techniques. World J Gastroenterol 2015; 21(16): 4894-4902
- URL: https://www.wjgnet.com/1007-9327/full/v21/i16/4894.htm
- DOI: https://dx.doi.org/10.3748/wjg.v21.i16.4894


