Copyright
©2013 Baishideng Publishing Group Co.
World J Gastroenterol. Jun 14, 2013; 19(22): 3423-3432
Published online Jun 14, 2013. doi: 10.3748/wjg.v19.i22.3423
Published online Jun 14, 2013. doi: 10.3748/wjg.v19.i22.3423
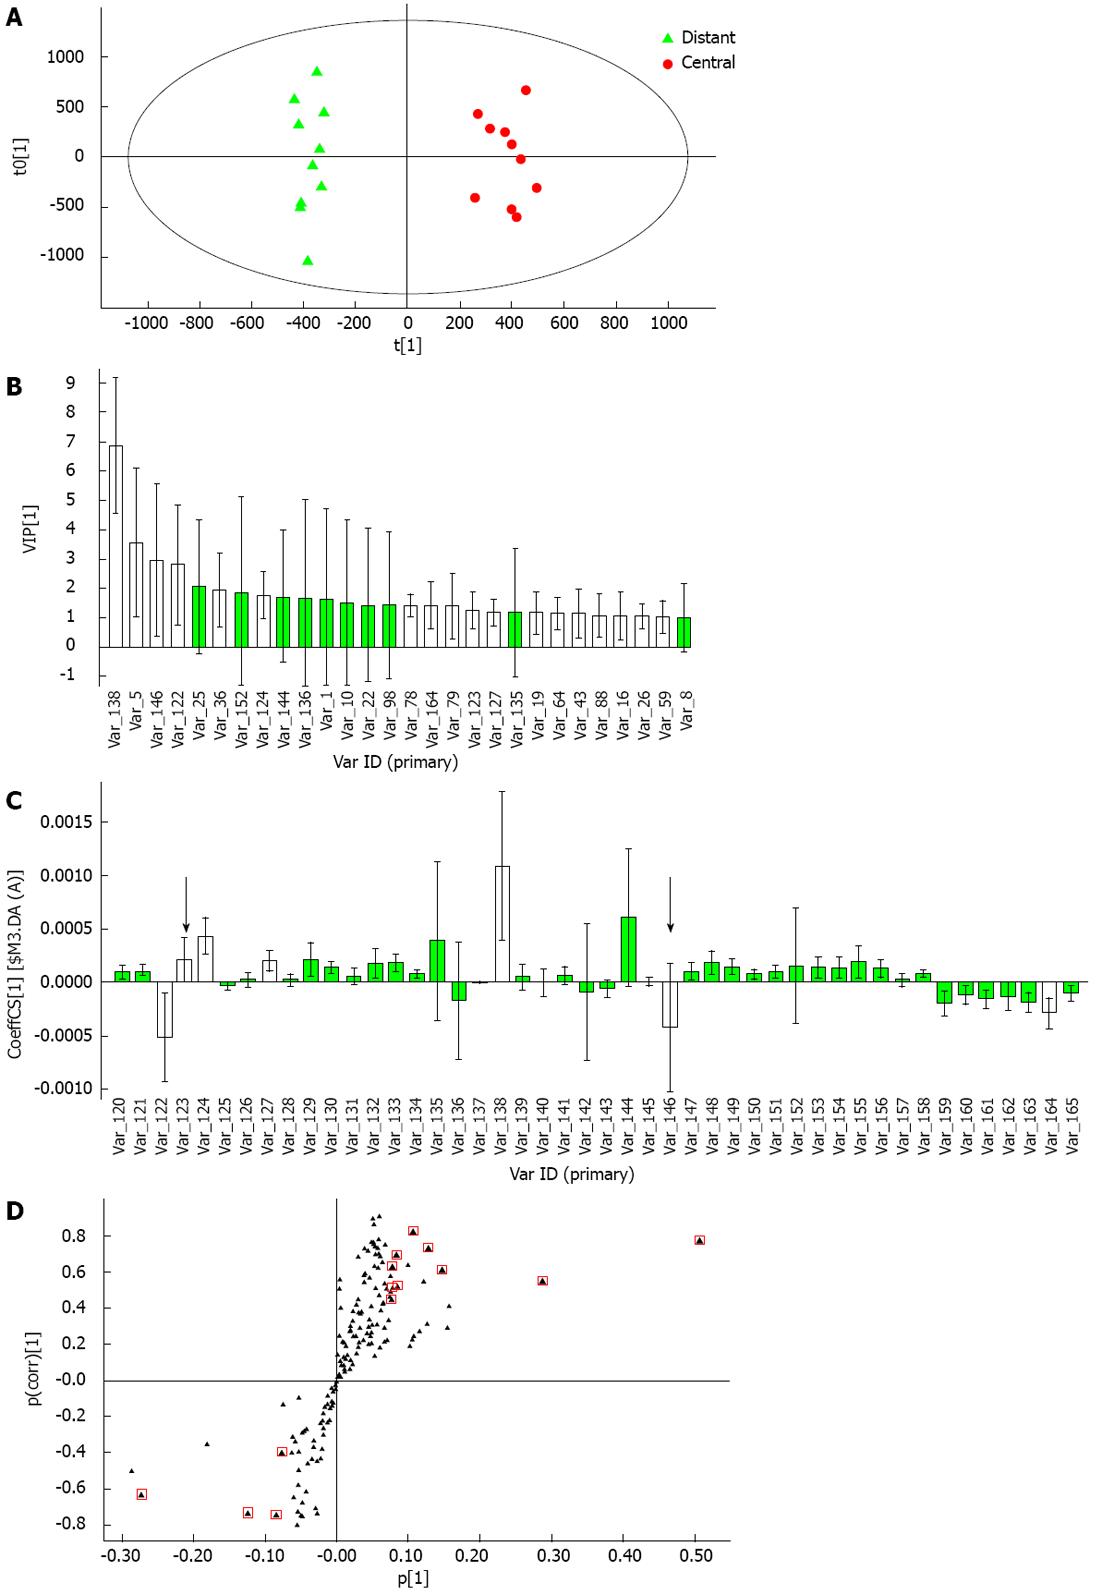
Figure 5 Selecting process of characteristic metabolites.
A: Orthogonal partial least squares discriminant analysis model of the central tumor tissue group and distant tissue group, each point in the figure represents a sample; B: Variable importance (VIP) diagram with confidence interval (green bars were excluded metabolites, the others were target metabolites); C: Coefficient plot of included variants in the VIP diagram (variants marked by arrows were excluded metabolites); D: S-plot of selected ions passed last two steps of filtering (points marked by red frame represent characteristic metabolites). Distant: Distant tissue group; Central: Central tumor tissue group.
- Citation: Liu SY, Zhang RL, Kang H, Fan ZJ, Du Z. Human liver tissue metabolic profiling research on hepatitis B virus-related hepatocellular carcinoma. World J Gastroenterol 2013; 19(22): 3423-3432
- URL: https://www.wjgnet.com/1007-9327/full/v19/i22/3423.htm
- DOI: https://dx.doi.org/10.3748/wjg.v19.i22.3423


