Copyright
©2013 Baishideng Publishing Group Co.
World J Gastroenterol. May 14, 2013; 19(18): 2761-2771
Published online May 14, 2013. doi: 10.3748/wjg.v19.i18.2761
Published online May 14, 2013. doi: 10.3748/wjg.v19.i18.2761
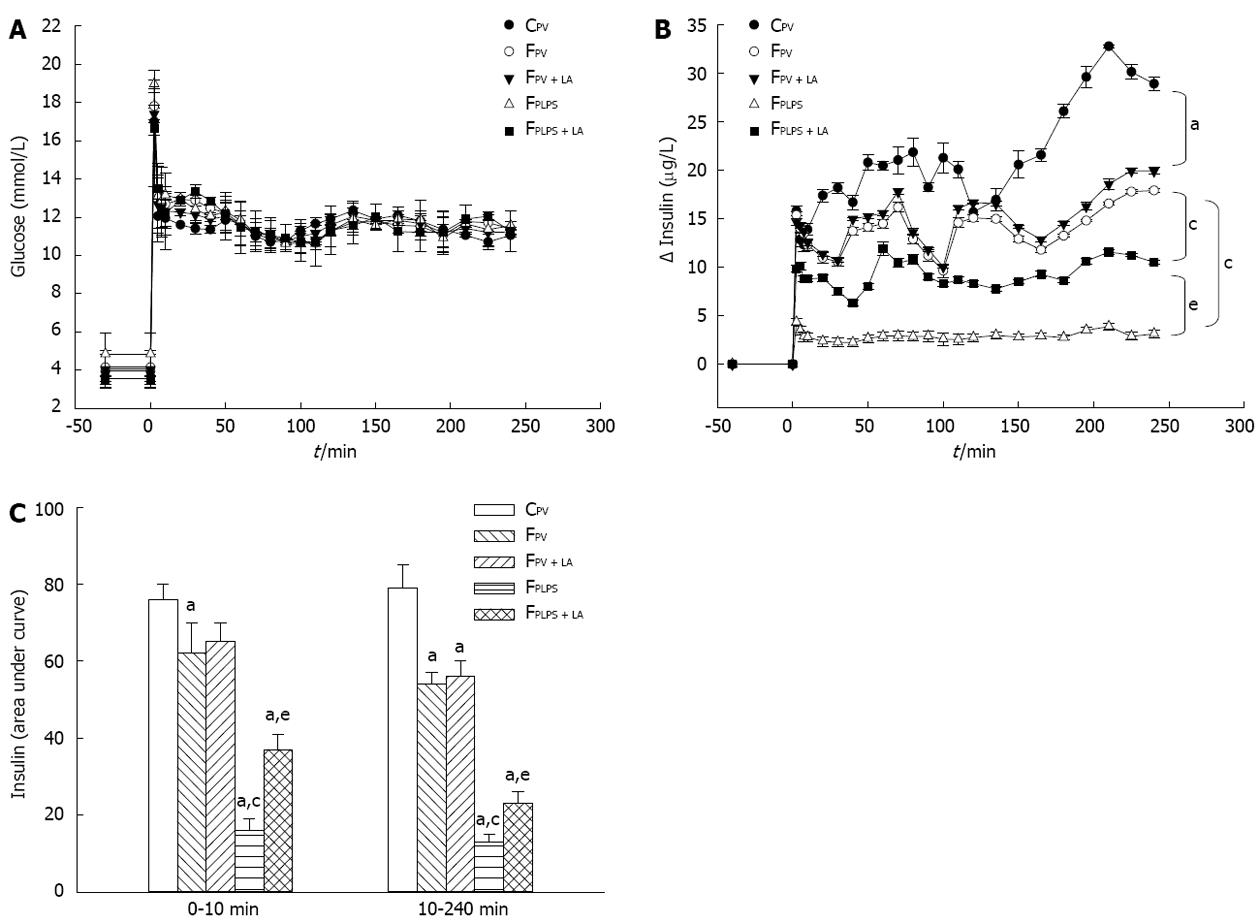
Figure 6 Effect of α-lipoic acid on plasma glucose and insulin levels.
A hyperglycemic clamp technique was used to evaluate glucose-stimulated insulin secretion. A: Plasma glucose levels during the clamp period; B: Change in insulin levels during clamp period; C: The insulin level averages during the first phase (0-10 min) and the second phase (10-240 min) of the clamp period. Values are expressed as mean ± SE, n = 6 per group. aP < 0.05 vs CPV; cP < 0.05 vs FPV; eP < 0.05 vs FPLPS. C: Regular diet; F: High-fructose enriched diet; LA: Lipoic acid; LPS: Lipopolysaccharides.
- Citation: Tian YF, He CT, Chen YT, Hsieh PS. Lipoic acid suppresses portal endotoxemia-induced steatohepatitis and pancreatic inflammation in rats. World J Gastroenterol 2013; 19(18): 2761-2771
- URL: https://www.wjgnet.com/1007-9327/full/v19/i18/2761.htm
- DOI: https://dx.doi.org/10.3748/wjg.v19.i18.2761


