Copyright
©2011 Baishideng Publishing Group Co.
World J Gastroenterol. Dec 7, 2011; 17(45): 4979-4986
Published online Dec 7, 2011. doi: 10.3748/wjg.v17.i45.4979
Published online Dec 7, 2011. doi: 10.3748/wjg.v17.i45.4979
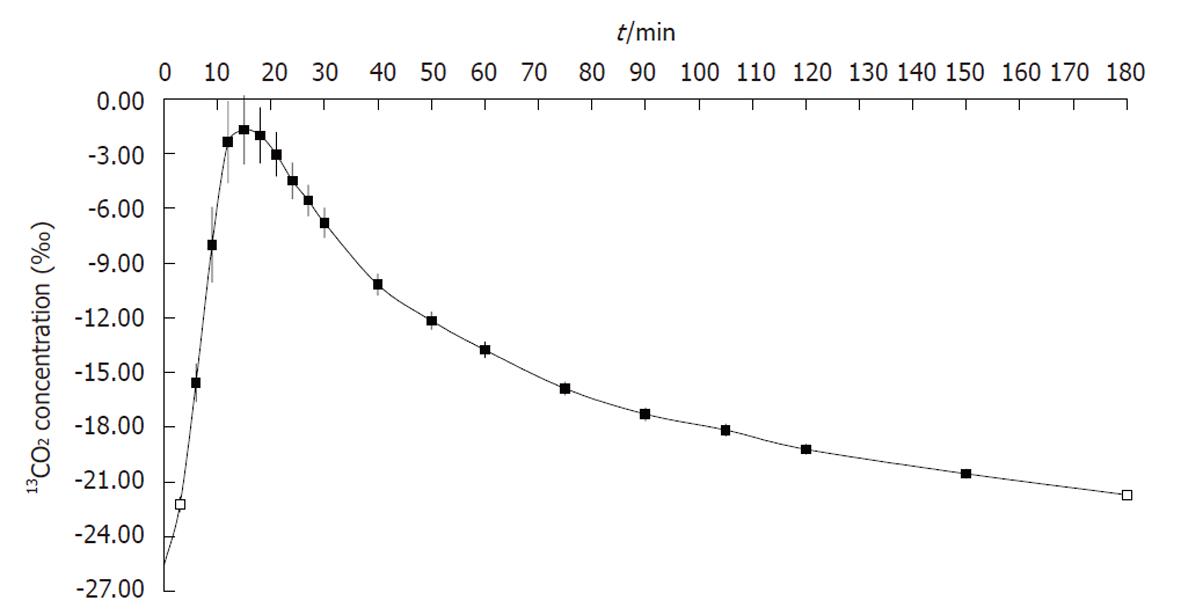
Figure 1 Time course of the 13CO2 content within the total pool of exhaled CO2 after peroral administration of 75 mg 13C-methacetin in 20 healthy volunteers who each underwent three breath tests on separate days.
Filled rectangles represent the time points at which the rise in 13CO2 concentration was statistically significantly different from the baseline measurement, open rectangles stand for values not statistically different from the baseline. The values shown are mean ± SE.
- Citation: Kasicka-Jonderko A, Nita A, Jonderko K, Kamińska M, Błońska-Fajfrowska B. 13C-methacetin breath test reproducibility study reveals persistent CYP1A2 stimulation on repeat examinations. World J Gastroenterol 2011; 17(45): 4979-4986
- URL: https://www.wjgnet.com/1007-9327/full/v17/i45/4979.htm
- DOI: https://dx.doi.org/10.3748/wjg.v17.i45.4979


