Copyright
©2011 Baishideng Publishing Group Co.
World J Gastroenterol. May 14, 2011; 17(18): 2343-2348
Published online May 14, 2011. doi: 10.3748/wjg.v17.i18.2343
Published online May 14, 2011. doi: 10.3748/wjg.v17.i18.2343
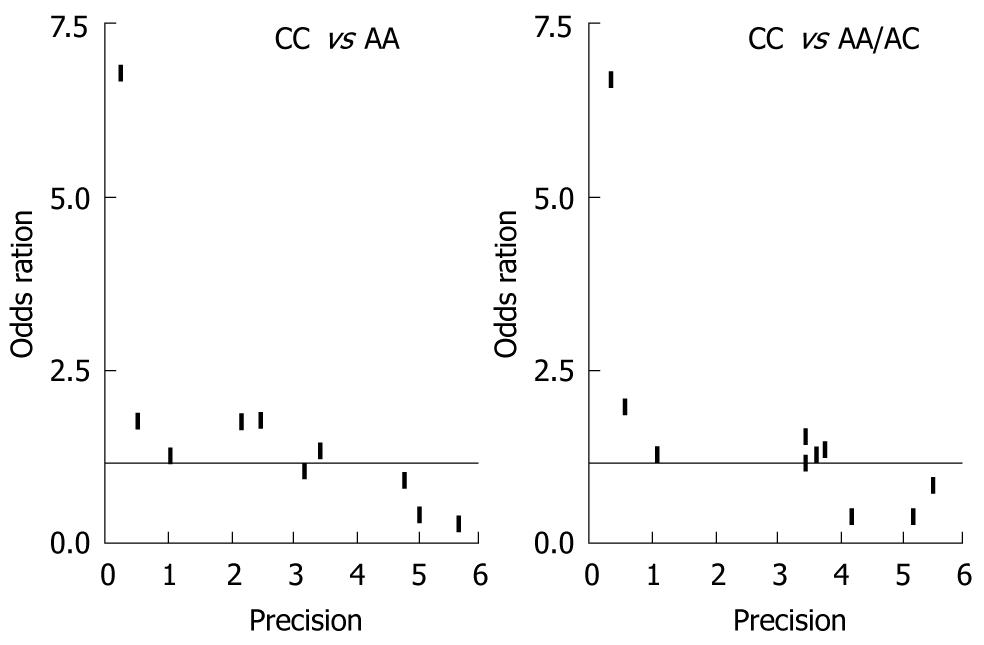
Figure 3 Funnel plot analysis to detect publication bias.
Each point represents a separate study for the indicated association. The Odds ration is plotted on a logarithmic scale against the precision (the reciprocal of the SE).
- Citation: Yuan L, Cui D, Zhao EJ, Jia CZ, Wang LD, Lu WQ. XPD Lys751Gln polymorphism and esophageal cancer risk: A meta-analysis involving 2288 cases and 4096 controls. World J Gastroenterol 2011; 17(18): 2343-2348
- URL: https://www.wjgnet.com/1007-9327/full/v17/i18/2343.htm
- DOI: https://dx.doi.org/10.3748/wjg.v17.i18.2343


