Copyright
©2010 Baishideng.
World J Gastroenterol. Jul 7, 2010; 16(25): 3161-3167
Published online Jul 7, 2010. doi: 10.3748/wjg.v16.i25.3161
Published online Jul 7, 2010. doi: 10.3748/wjg.v16.i25.3161
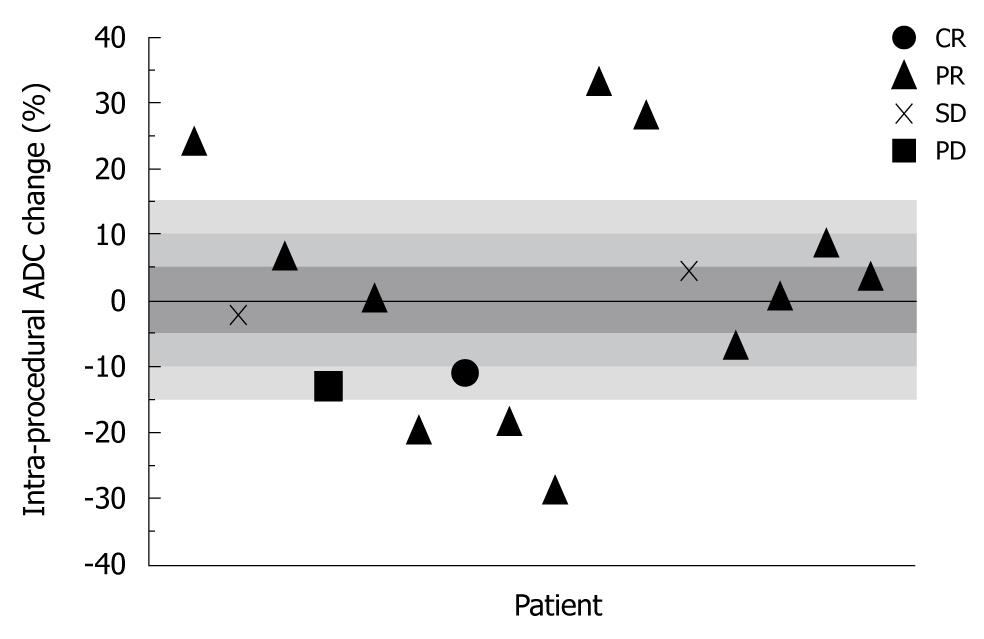
Figure 2 Scatter-plot graph of 16 separately treated HCC lesions showing intra-procedural ADC percent change and their corresponding 1-mo EASL status.
ADC: Apparent diffusion coefficient; HCC: Hepatocellular carcinoma; EASL: European Association for the Study of the Liver; CR: Complete response; PR: Partial response; PD: Progressive disease; SD: Stable disease.
- Citation: Chung JC, Naik NK, Lewandowski RJ, Deng J, Mulcahy MF, Kulik LM, Sato KT, Ryu RK, Salem R, Larson AC, Omary RA. Diffusion-weighted magnetic resonance imaging to predict response of hepatocellular carcinoma to chemoembolization. World J Gastroenterol 2010; 16(25): 3161-3167
- URL: https://www.wjgnet.com/1007-9327/full/v16/i25/3161.htm
- DOI: https://dx.doi.org/10.3748/wjg.v16.i25.3161


