Copyright
©2010 Baishideng.
World J Gastroenterol. May 21, 2010; 16(19): 2421-2427
Published online May 21, 2010. doi: 10.3748/wjg.v16.i19.2421
Published online May 21, 2010. doi: 10.3748/wjg.v16.i19.2421
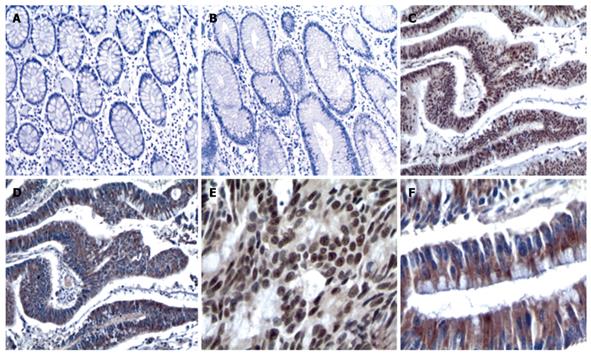
Figure 1 Expression of EZH2 (A, C, E) and nuclear STAT6 (B, D, F) in adjacent non-neoplastic tissues and CRC tissues visualized by DAB.
A: Non-neoplastic tissues stained with EZH2; B: Non-neoplastic tissues stained with STAT6; C, E: Tumor tissues stained with EZH2; D, F: Tumor tissues from the same case stained with STAT6. Original magnifications: × 100 (A-D); × 400 (E, F).
- Citation: Wang CG, Ye YJ, Yuan J, Liu FF, Zhang H, Wang S. EZH2 and STAT6 expression profiles are correlated with colorectal cancer stage and prognosis. World J Gastroenterol 2010; 16(19): 2421-2427
- URL: https://www.wjgnet.com/1007-9327/full/v16/i19/2421.htm
- DOI: https://dx.doi.org/10.3748/wjg.v16.i19.2421


