Copyright
©2010 Baishideng.
World J Gastroenterol. May 21, 2010; 16(19): 2362-2370
Published online May 21, 2010. doi: 10.3748/wjg.v16.i19.2362
Published online May 21, 2010. doi: 10.3748/wjg.v16.i19.2362
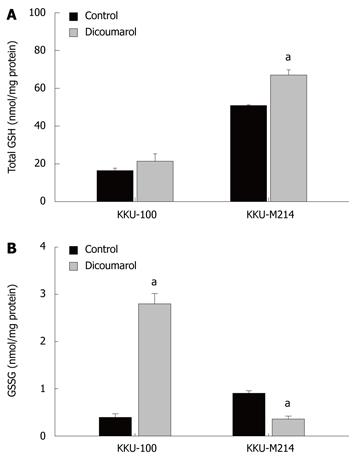
Figure 4 Glutathione redox status in cells treated with dicoumarol.
KKU-100 and KKU-M214 cells were cultured and treated with dicoumarol (10 μmol/L) for 4 h, and cells were scraped for assays of (A) total glutathione and (B) glutathione disulfide. Bars represent mean ± SE, each from 3 experiments. aP < 0.05 vs control group.
- Citation: Buranrat B, Prawan A, Kukongviriyapan U, Kongpetch S, Kukongviriyapan V. Dicoumarol enhances gemcitabine-induced cytotoxicity in high NQO1-expressing cholangiocarcinoma cells. World J Gastroenterol 2010; 16(19): 2362-2370
- URL: https://www.wjgnet.com/1007-9327/full/v16/i19/2362.htm
- DOI: https://dx.doi.org/10.3748/wjg.v16.i19.2362


