Copyright
©2009 The WJG Press and Baishideng.
World J Gastroenterol. Oct 14, 2009; 15(38): 4799-4805
Published online Oct 14, 2009. doi: 10.3748/wjg.15.4799
Published online Oct 14, 2009. doi: 10.3748/wjg.15.4799
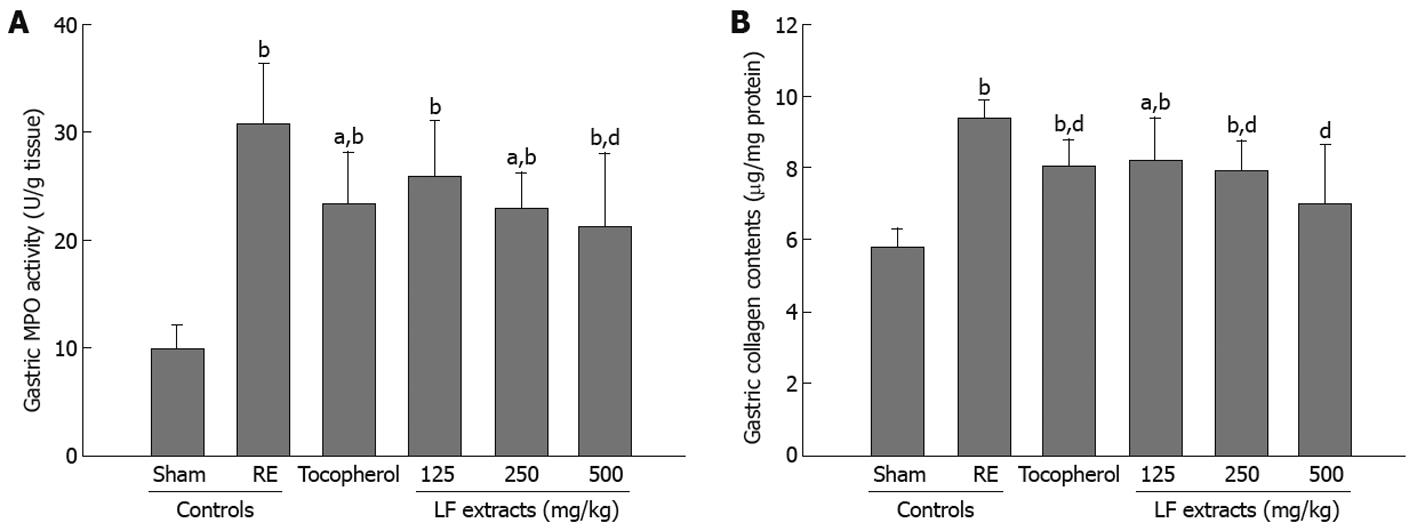
Figure 3 Changes on the gastric MPO activity (A) and gastric collagen contents (B) in RE rats.
Values are expressed mean ± SD of five rats. bP < 0.01 compared to Sham control; aP < 0.05 and dP < 0.01 compared to RE control.
- Citation: Ku SK, Seo BI, Park JH, Park GY, Seo YB, Kim JS, Lee HS, Roh SS. Effect of Lonicerae Flos extracts on reflux esophagitis with antioxidant activity. World J Gastroenterol 2009; 15(38): 4799-4805
- URL: https://www.wjgnet.com/1007-9327/full/v15/i38/4799.htm
- DOI: https://dx.doi.org/10.3748/wjg.15.4799


