Published online Dec 28, 2008. doi: 10.3748/wjg.14.7335
Revised: August 16, 2008
Accepted: August 23, 2008
Published online: December 28, 2008
AIM: To describe a quantitative analysis method for liver biopsy sections with a machine that we have named “Dioguardi Histological Metriser” which automatically measures the residual hepatocyte mass (including hepatocytes vacuolization), inflammation, fibrosis and the loss of liver tissue tectonics.
METHODS: We analysed digitized images of liver biopsy sections taken from 398 patients. The analysis with Dioguardi Histological Metriser was validated by comparison with semi-quantitative scoring system.
RESULTS: The method provides: (1) the metrical extension in two-dimensions (the plane) of the residual hepatocellular set, including the area of vacuoles pertinent to abnormal lipid accumulation; (2) the geometric measure of the inflammation basin, which distinguishes intra-basin space and extra-basin dispersed parenchymal leukocytes; (3) the magnitude of collagen islets, (which were considered truncated fractals and classified into three degrees of magnitude); and (4) the tectonic index that quantifies alterations (disorders) in the organization of liver tissue. Dioguardi Histological Metriser machine allows to work at a speed of 0.1 mm2/s, scanning a whole section in 6-8 min.
CONCLUSION: The results are the first standardized metrical evaluation of the geometric properties of the parenchyma, inflammation, fibrosis, and alterations in liver tissue tectonics of the biopsy sections. The present study confirms that biopsies are still valuable, not only for diagnosing chronic hepatitis, but also for quantifying changes in the organization and order of liver tissue structure.
- Citation: Dioguardi N, Grizzi F, Fiamengo B, Russo C. Metrically measuring liver biopsy: A chronic hepatitis B and C computer-aided morphologic description. World J Gastroenterol 2008; 14(48): 7335-7344
- URL: https://www.wjgnet.com/1007-9327/full/v14/i48/7335.htm
- DOI: https://dx.doi.org/10.3748/wjg.14.7335
| Parameter | min | max |
| Residual hepatocellular set | ||
| Residual hepatocellular set (%) | 67.97 | 99.59 |
| Inflammation | ||
| Inflammatory cell cluster space (%) | 0 | 8.71 |
| Pure inflammatory cell cluster space (%) | 0 | 3.67 |
| Extra-basin inflammatory space (%) | 0 | 1.14 |
| Fibrosis | ||
| Area of Sample covered by fibrosis (%) | 0 | 32 |
| Islets magnitude | ||
| 10-103 (%) | 8.9 | 100 |
| 103-104 (%) | 0 | 58.15 |
| > 104 (%) | 0 | 87.4 |
| Wrinkledness | 0 | 1666 |
| Tectonic Index | ||
| Liver tissue | 0 | 0.78 |
| Low or no disorder | 0 | 0.4 |
| Middle disorder | 0.4 | 0.6 |
| High disorder | 0.6 | 1 |
| n | Uncorrected fibrosis extension range (%) | Mean increase of fibrosis extension after IS meter correction (%) | min (%) | max (%) |
| 193 | 0-3 | 25 | 0 | 65 |
| 156 | 3-10 | 10 | 5 | 18 |
| 49 | 10-40 | 4 | 2 | 6 |
| Δmetrical measure | Semi-quantitative evaluations | |||||
| HAI | Scheuer | Ishak | METAVIR | Average | ||
| Increase | 24 | 19 | 26 | 26 | 23 | 23.5 |
| Stationarity | 0 | 30 | 23 | 18 | 25 | 24.0 |
| Decrease | 37 | 12 | 12 | 17 | 13 | 13.5 |
| Δmetrical measure | Semi-quantitative evaluations | |||||
| HAI | Scheuer | Ishak | METAVIR | Average | ||
| Increase | 35 | 16 | 16 | 23 | 7 | 15.5 |
| Stationarity | 1 | 25 | 22 | 19 | 36 | 25.5 |
| Decrease | 25 | 20 | 23 | 19 | 18 | 20.0 |
| Δmetrical measure | Semi-quantitative evaluations | |||||
| HAI | Scheuer | Ishak | METAVIR | Average | ||
| Increase | 42 | 19 | 26 | 26 | 23 | 23.5 |
| Stationarity | 0 | 30 | 23 | 18 | 25 | 24.0 |
| Decrease | 19 | 12 | 12 | 17 | 13 | 13.5 |
| Δof loss of the natural liver tissue order | Semi-quantitative evaluations | |||||
| HAI | Scheuer | Ishak | METAVIR | Average | ||
| Increase | 46 | 19 | 26 | 26 | 23 | 23.5 |
| Stationarity | 3 | 30 | 23 | 18 | 25 | 24.0 |
| Decrease | 12 | 12 | 12 | 17 | 13 | 13.5 |
| Examination | Side effects | Ref. | |
| Serious complications (%) | Mortality (%) | ||
| Liver biopsy | 0.5 | > 0.02 | 31 |
| Oesophagogastroduodenoscopy | 0.01 | 31 | |
| Colonoscopy | 0.3 | 0.02 | 31-33 |
| Flexible sigmoidoscopy | 0.0001 | 32, 34 | |
| Endoscopic retrograde cholangiopancreatography | 5-10 | 0.1-1 | 32, 35, 36 |
| Percutaneous transhepatic cholangiography | 3 | 32 | |
| Contrast agents | 2-10 | 37-39 | |
The main purpose of this paper is to describe a rigorous method based on the fundamentals of measurement theory[1], which metrically defines the changes in magnitude of liver tissue prime basic structural elements that occurring during the course of chronic hepatitis B and C.
Each available score to evaluate hepatic lesions is characterized by some methodological inaccuracy[2-4]. In fact, transient elastography (Fibro-Scan)[5,6] is limited by the skill of the operator and because liver stiffness is not only dependent from fibrosis, and serological assays not directly involved in tissue evolution, but in patient diagnosis[7-11]. In addition to the inherent risks of excising a liver specimen[12], current morphometric analyses[13-17] are time-consuming, depend on subjective choices of the regions of interest, involve the interactive elimination of Glisson’s capsule and staining artefacts, and use the International System (IS), which is unsuitable for measuring the irregular shapes found in histology[18-21].
The study concerning the status of the liver tissue affected by chronic viral hepatitis was suggested by three main needs. The first was ethical because methodological accuracy and repeatability are essential. The second was clinical because many problems remain unsolved in hepatology, such as non-responders to therapy[3], and regression of cirrhosis[2]. The third need was economic, as the price of the metrical data supplied by the “Dioguardi Histological Metriser” analysis is relatively low, and the repeatable biopsy interpretation is obtained with a few minutes.
The lack of an appropriate geometry had prevented the real measurement of irregular liver structures, until Mandelbrot’s fractal geometry[22] (also called the geometry of irregularity) offered a correct approach for obtaining reproducible and closer to reality metrical measurements of hepatocellular mass, inflammation, and fibrosis, and also provided a quantitative index for evaluating the organization of liver tissue tectonics. In order to apply these new measurements, we constructed a practical and fully-automated machine that we called the “Dioguardi Histological Metriser”, which is capable of measuring 10 parameters to describe the status of the residual hepatocyte mass (including hepatocyte vacuolization), inflammation, fibrosis, and the loss of liver tissue tectonics in liver biopsy sections, at a speed of 0.1 mm2/s. Hepatitis B and C virus infections do not usually affect the biliary system.
The study concerning the status of the liver tissue affected by chronic viral hepatitis B and C, was suggested by three main needs: (1) Ethical: methodological accuracy and reproducibility are essential; (2) Clinical: because many questions remain unsolved in hepatology, such as non-responders patients to therapy[3], and regression of cirrhosis[2]; (3) Economical: metrical data analysis supplied by the “Dioguardi Histological Metriser” is not expensive reproducible and is obtained within a few minutes.
We studied 398 patients randomly collected (250 male) aged 52 ± 12 years with chronic hepatitis B or C, who were admitted to the hepatology departments of the Istituto Clinico Humanitas (ICH) IRCCS, Rozzano, and the University of Milan Department of Gastroenterology, Ospedale Maggiore IRCCS, Milan, Italy. The biopsies were performed in accordance with the guidelines of the Ethics Committees of ICH and Ospedale Maggiore IRCCS. All of the liver specimens were approximately 17 ± 12 mm2.
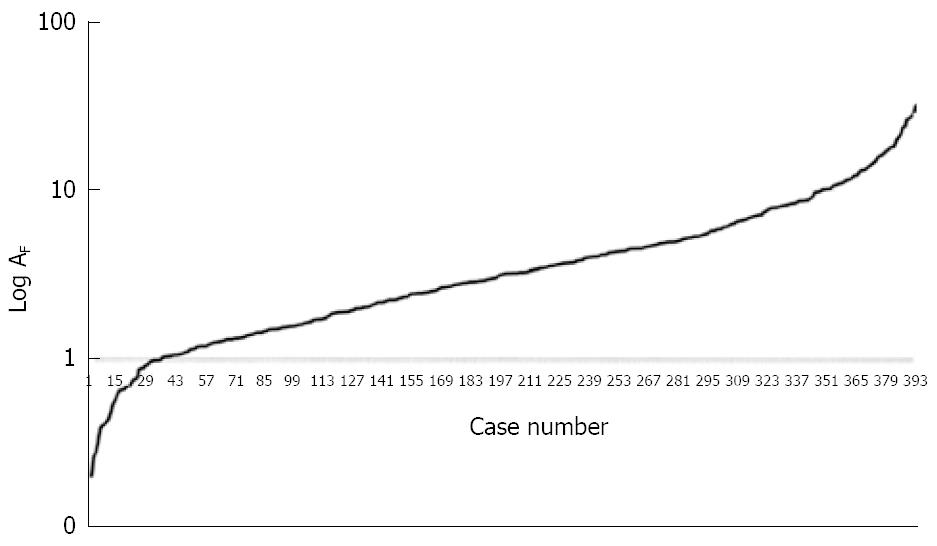
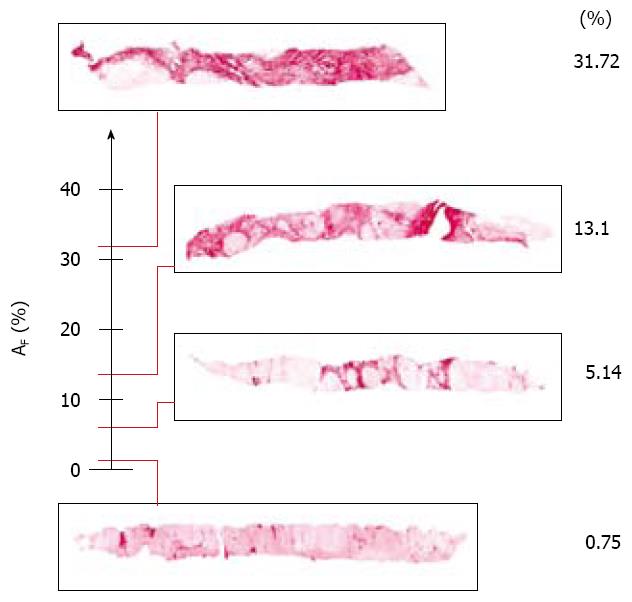
The logarithmic curve of the ordered set according to the fibrosis data magnitude obtained from the 398 patients, can be interpreted as the trajectory (from α to ω)of the ideal dynamics of collagen deposition during the course of chronic hepatitis (Figure 1).
Three consecutive 2 μm thick sections were cut from formalin-fixed, paraffin-embedded biopsy specimens: the first was stained with hematoxylin and eosin for diagnostic purposes; the second was treated to identify inflammatory cells by using monoclonal antibodies raised against leukocyte common antigen (LCA: Dako, Milan, Italy) and a standardized immunoperoxidase method[23], and hepatocellular lipids vacuoles; and the third was stained with Sirius red to visualize fibrosis.
Expert hepatopathologists graded and staged the biopsy sections using the Knodell[24], Sheuer[25], Ishak[26], and METAVIR[27] semi-quantitative scoring systems.
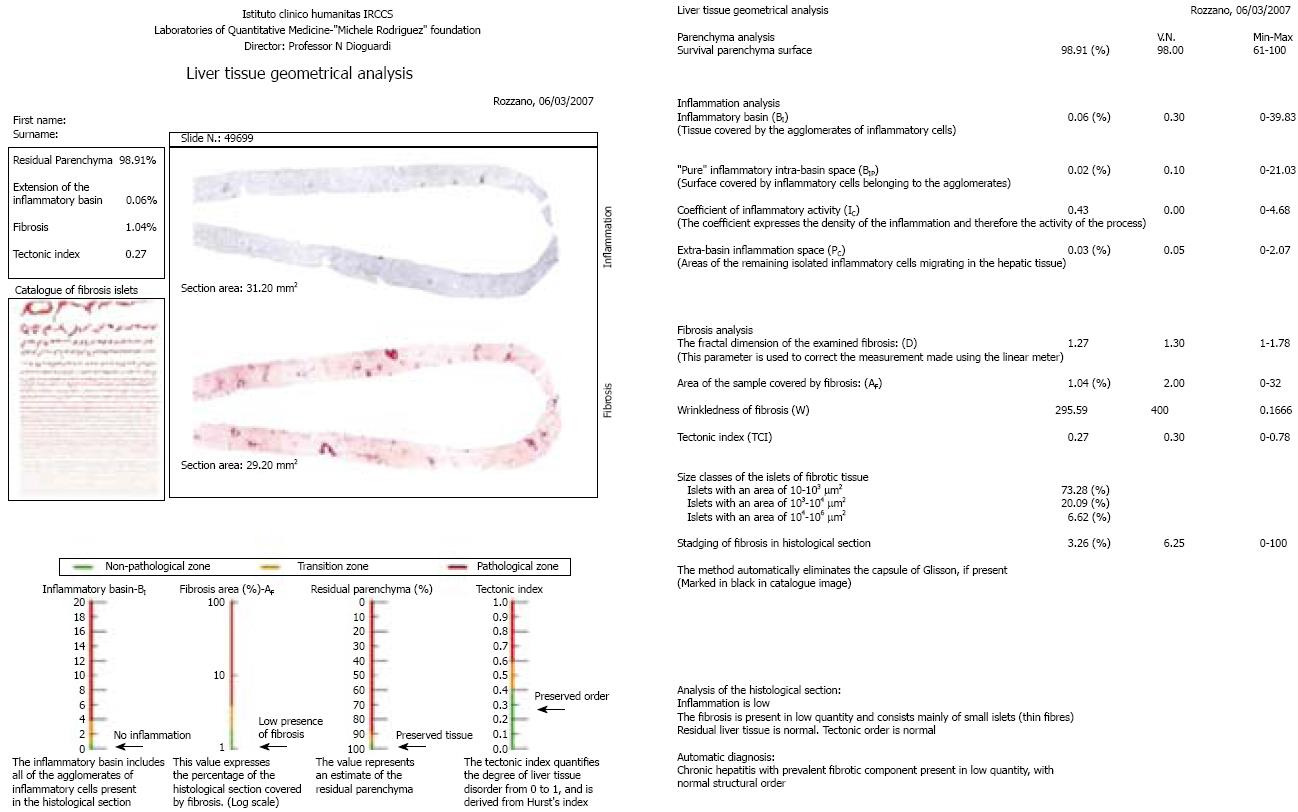
A specific example of the set of metrical parameters obtained by quantitatively evaluating liver residual parenchyma, inflammation, fibrosis, and disordered liver tissue tectonics is shown in Figure 2.
Variations in the water bath temperatures used to distend the histological sections were tested at 41, 43, 45 and 47°C, (which accounted for 12% of the variations in fibrosis). Variations in paraffin section thickness were tested using five sequential thicknesses from 2-6 μm, (which accounted for 20% of the variations in fibrosis). Variations in staining times (tested using nine sequential sections stained with a freshly-made Sirius red solution for 15-135 min), (which accounted for 13% of the variations in fibrosis). Intra-sample variability in the tissue area covered with Sirius-red-stained collagen was assessed using three series of thirty 2 μm-thick sections obtained from three biopsies, two series of fifteen 4 μm-thick sections obtained from two further biopsies, and one series of ten 6 μm-thick sections obtained from a sixth biopsy. The results showed wide intra-sample variability, because of the highly irregular distribution of the collagen matrix. Also the loss of the thinner matrix components because of histological section processing might have play played a role in this result.
The results were analyzed using Statistica software (StatSoft Inc., Tulsa, OK, USA). Variability was evaluated using the coefficient of variation (CV) given by the formula CV = (SD/mean) × 100%. P values of less than 0.05 were considered statistically significant.
Our model for measuring the state of liver tissue is based on two canonical points: the choice of the prime structural elements of the tissue, and the most general kind of tissue organization[1].
Prime structural elements (determine property of the system) and are the most representative structural elements of an organ tissue insofar as they have the property of changing their shape and size over time, without losing their individuality.
Prime liver structural elements were considered: (1) the parenchyma (i.e. the substantia jecuris), which consists of the hepatocytic mass that, in this phase of the research, includes regenerative nodular hepatocytes; (2) the dispersed set of topical immunological cells; (3) the collagen scaffold that consists collagen fibers and included the portal spaces; and (4) the tectonic, defined by the Malpighi-Kiernan lobular organization of the liver. All of these elements were taken in their strictly structural form.
The most general kind of organization[1] of an organ tissue is the state of its prime structural elements defined by quantitative relationships. It determines tissue tectonics and the reference for every structural change in organ architecture which, in the case of the liver, is the lobular structure.
Pathological events occurring during the course of chronic viral hepatitis transform the shape and size of these prime physical structures, and consequently alter the most general organization of the liver system.
The main events altering the natural physical state of the prime structural elements and tectonics of liver tissue, are enlargement, reduction and “vacuolization”. The pathological transformations determined by these events during the course of chronic viral hepatitis, can be interpreted as follows: (1) necrosis reduces lipid hepatocyte determines vacuolization increases the size of the parenchyma; (2) Increase in the number of dispersed cells generated by the topical general immune system determine inflammatory cell clusters; (3) Growth of septa that evolve into porto-portal or porto-central fibrotic bridges results in expansion of the collagen support network (which appears as Sirius-red-stained islets in a histological section). Taken together these individual transformations (in shape and size) generate a loss of the natural harmony in the inter-relationship of the prime elements. This loss of order is also measurable.
We designed and built our own user-friendly Liver Tissue Geometric Analyser (LTGA or Dioguardi Histological Metriser; patent pending), which automatically ensures correct microscope focusing, metrically evaluates the image of an entire digitalized histological slide, and defines the areas covered by the residual parenchymal mass (including lipid vacuolization), inflammation and fibrosis; it also disregards any unfilled spaces (vascular and biliary cavities or sinusoidal spaces) and artifactual tissue-free spaces.
The Dioguardi Histological Metriser consists of two parts: a “client” (or dedicated microscope system) that captures and digitizes the images of the specifically stained histological section, and a central “server” that receives the images, automatically measures the parameters listed in Table 1, and sends the results back to the client.
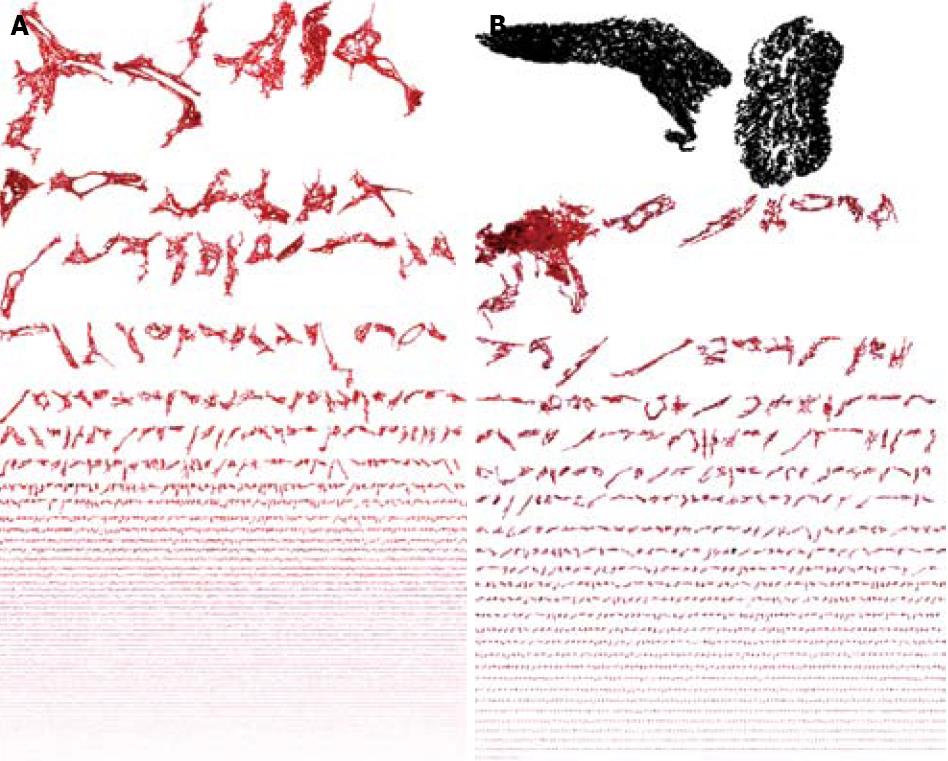
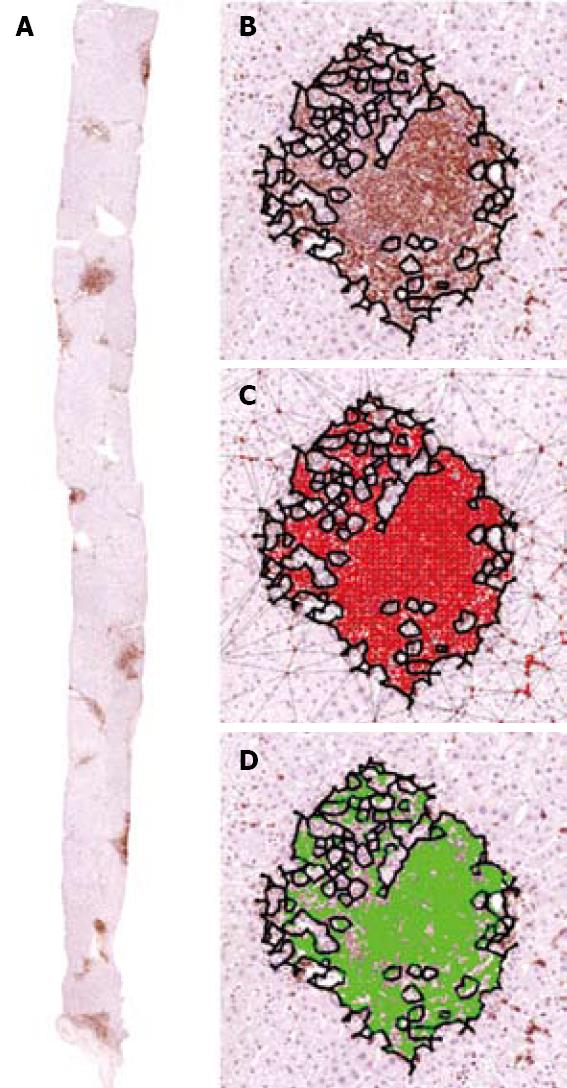
In this study, the microscope system consisted of a Leica DMLA microscope (Leica, Milan, Italy) equipped with an X-Y translator table, a digital camera (QICam, QImaging, Surrey, Canada), and an Intel Pentium 4, 2.60 GHz computer. We used ad hoc built-in image analysis software that automatically filtered, selected, and marked the outlines of the images of interest using color thresholds based on the levels of red, green and blue. All of the measurements were made at 10 × objective magnification. The Dioguardi Histological Metriser automatically selected and excluded Glisson’s capsule from the computation of fibrosis by means of an appropriate algorithm (Figure 3).
The minimum and maximum scalars obtained empirically on the basis of the Dioguardi Histological Metriser measurements of 398 biopsies are shown in Table 1.
We took as a reference for the following measurements the physical transformation average of the areas of the studied histological section.
Residual parenchymal mass: We consider the surviving hepatocellular set that remains after necrotic viral destruction, together with the nodular regenerated hepatocytes.
This surviving part of the hepatocellular set (residual mass) is expressed as a percentage of the reference area using the formula:
HS = 100% - AI - AF
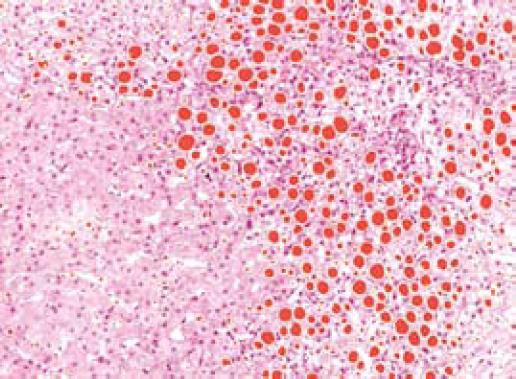
Where HS is the area of the residual hepatocellular set, AI the sum of the area of the inflammation basin, and AF the area covered by fibrosis. Vacuolization is due to the accumulation of lipids within hepatocytes (Figure 4). In this phase of the research we included lipid vacuoles in the residual parenchyma. The extension of these cytoplasmic enclaves was measured separately, to define the steatosis grade.
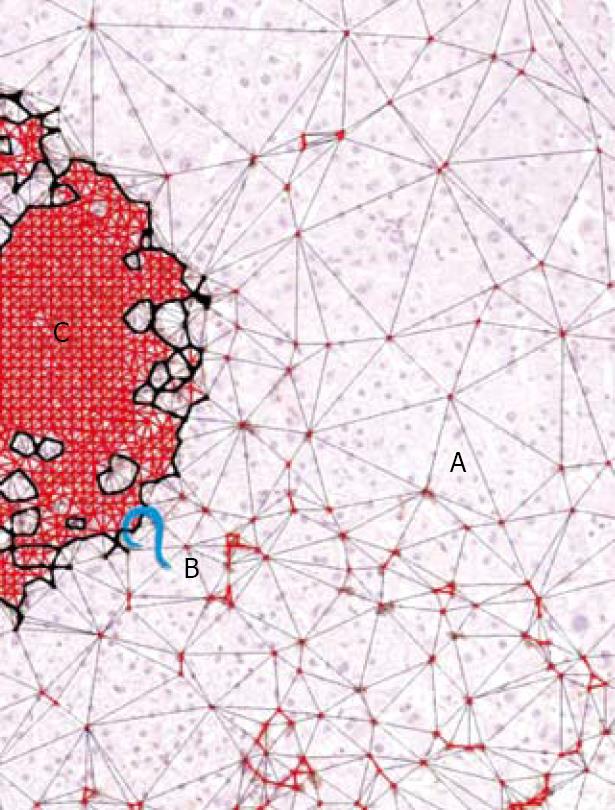
Inflammation basin: We called the inflammation basin (Figure 5A) the classic liver tissue pattern characterized by various sets of spatial immune-cell aggregates[23]. We consider three components. (1) Inflammatory cell clusters (Figure 5B). The boundaries of this dot-like pathological structure are arbitrarily fixed using Delaunay’s triangulation (Figure 5C), which defines their edges, as a continuous line, connecting the centers of the outermost cells (with a maximum distance of 20 μm)[23]. This line separates the intra-cluster inflammatory cells, from the immunologically evidenced parenchymal leukocytes throughout the tissue[23]. (2) Intra-cluster inflammatory space (Figure 5D), which is intra-cluster area covered by resident inflammatory cell bodies micro-areas[23]. (3) Extra-cluster inflammatory space, which is the sum of micro-areas covered by individual inflammatory cells that remain outside the clusters, within the liver tissue interstitium (Figure 6)[23].
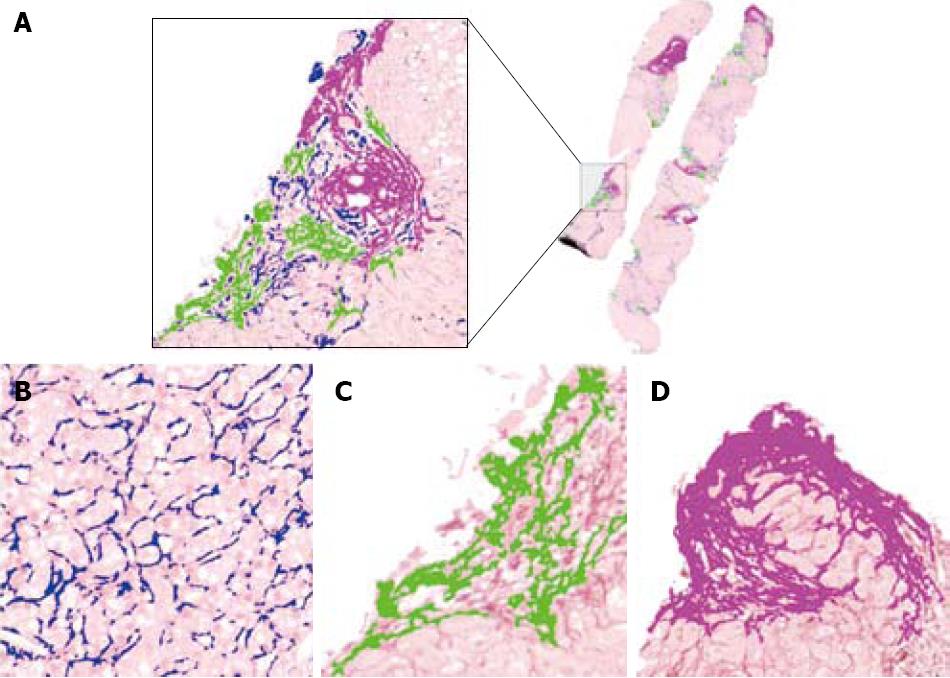
Fibrosis: The fibrotic framework appears as a multifarious set of collagen islets (Figure 3). Three classes of collagen islets were arbitrarily identified on the basis of their area the first one included islets with an area of between 10 and 103μm2, the second are those with an area of between 103 and 104μm2, and the third are those with an area of > 104μm2[21] (Figure 7).
The wrinkledness of collagen islets is calculated using the formula:
Where wrinkledness (W) is expressed as the ratio between the perimeter and area of an object[21], P is the fractal-corrected perimeter of the collagen area, A the fractal-corrected collagen area, and R the roundness coefficient of the collagen islets[21].
Liver tectonics: Natural liver tectonics defines the organization of the intersecting elements of liver tissue. The tectonic order was quantitatively described by the Tectonic Index (TCI, which ranges from 0 to 1) obtained using the Euclidean and fractal dimensions and TCI was obtained from H using the conversion formula:
TCI = 1 - H
Where H = Dγ + 1 - D, in which D is the fractal dimension and Dγ the Euclidean dimension.
TCI describes the loss of tissue organization or any deviation from natural order: a high TCI indicates a high degree of tissue disorder, and a low TCI indicates a low degree of tissue disorder. It can therefore be written:
TCI = 1 - H = D - Dγ
The irregularity of collagen islets makes it impossible to measure them using IS linear units unless these units are corrected by means of fractal dimension[20,21]. This correction makes it possible to include details of shape that escape (or do not interact with) linear unit measurements at any given scale[20,21]. We derived the fractal dimension using the box-counting method[20,21,28,29]. Since the biological objects has been classified as “truncated fractals”[20,21,30] we used the fractal dimension to correct the reference units as a dilation factor[20,21].
Table 2 shows the differences between the uncorrected and fractal dimension-corrected IS measurements.
The Dioguardi Histological Metriser resolution was assessed by computing the surface area of liver fibrosis in 13 tissue sections, and repeating the measurements 10 times in order to define the instrument error. Two objects were considered distinct if, and only if, their values and 95% confidence intervals (twice the standard deviation of the experimental values) did not overlap. The Dioguardi Histological Metriser distinguished 68 different categories, as against the six of Ishak, the five of the METAVIR scoring system, and the four of Knodell’s or Sheuer’s methods. The mean distance between the data with no overlap was 0.786% (range: 0.056%-2.216%).
The selective power of the metrical quantifications defines the capacity of the method to distinguish small differences in magnitude.
A study a part, was performed to define differences of the metrical date concerning residual hepatocytic mass inflammation, fibrosis and liver tissue tectonics on the same patient. The digital images of 61 pairs of histological biopsies from patients with hepatitis C virus-dependent disease. The first measurement was made 4-15 years after of the interval (after the antiviral treatment). The aim was to study the date differences after a long and irregular time.
For each pair of biopsies, we studied: (1) the difference (Δ) between the scalar measurements performed with Dioguardi Histological Metriser; and (2) the changes of the semiquantitative evaluation with the four most widely used semi-quantitative methods (Knodell, Sheuer, Ishak, METAVIR).
Juxtaposing the quantitative variations in the metrical measurements with the time to the same parameters studied by means of the semi-quantitative methods in order to collate the results of the two scores, we found the following. (1) The metrical measurements of residual parenchyma gave, in comparison to semi-quantitative results, fewer indications of no change and more indications of decreases (Table 3). (2) The metrical measurements of inflammation gave more indications of increases, and fewer indications of no change than the semi-quantitative results (Table 4). (3) The metrical measurements of fibrosis gave more indications of increases and fewer indications of no change than the semi-quantitative results (Table 5). (4) The quantitative evaluations of the tectonic index of liver architecture gave more indications of increased disorder, and fewer indications of no change than the semi-quantitative results (Table 6).
To compare the difference of the metrical scalars, with the ordinally numbered categories is not possible, because metrical measurements are in continuum (and thus additive with successive points separated by Δ = 0), whereas semi-quantitative evaluations are discrete and not additive with intervals of Δ≠ 0.
On the straight line of real numbers, we reported the value of the cases grouped by each category recognized with the current semi quantitative scoring systems.
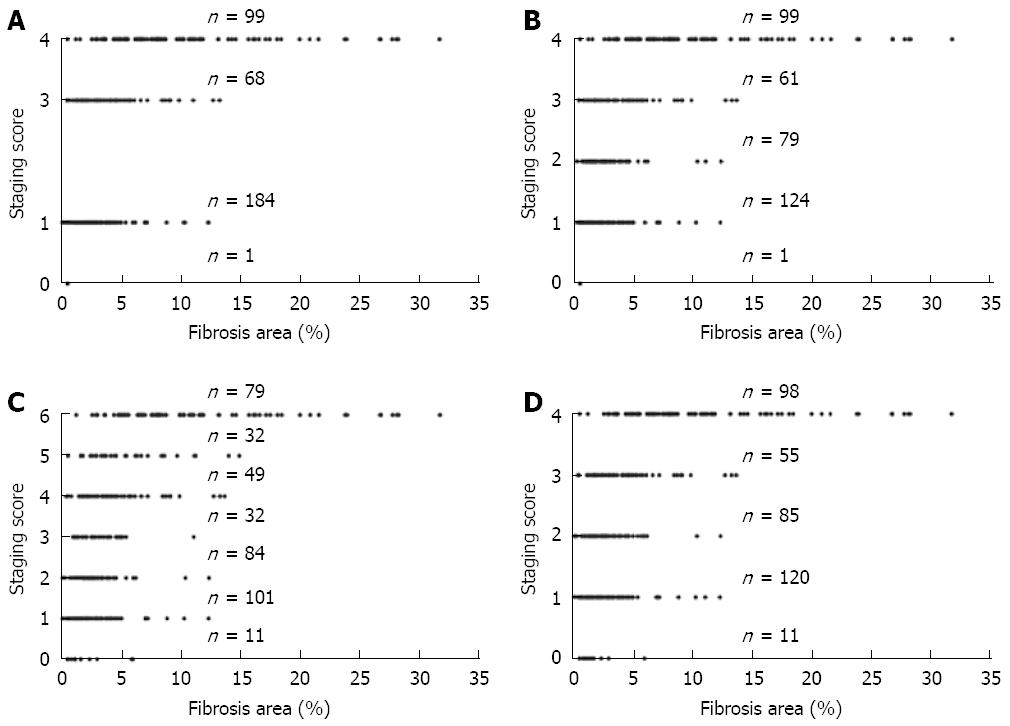
The collate of the distribution of the data reported on the state shows the overlapping of the metrical measurements that correspond to patients classified in different semi quantitative categories (Knodell, Ishak, Sheuer, and METAVIR). This highlights the inadequacy of all four semi-quantitative methods in discriminating different states of liver fibrosis (Figure 8).
Our method distinguished three classes of collagen islets with magnitudes arbitrarily fixed at 10-103μm2, 103-104μm2, and > 104μm2 (Figure 7). As the process of fibrosis is a progressive deposition of extracellular matrix that coalesces into islets that are subsequently thickened by matricial deposits, it can be speculated that thin islets indicate the initiation and persistence of inflammation.
Stad-ging indicates the part of the disease course already covered and the part that remains to be covered, before it reaches its end. It is established by placing the value of fibrosis (expressed as a scalar) on the ideal trajectory that indicates the phase of fibrosis, at the time of measurement (Figure 9)[21]. In brief, stad-ging indicates the tendency of the process to evolve in both senses from one state to another.
The staging and stad-ging of fibrosis are different insofar as the former indicates the current fibrotic state, and the latter indicates the phase of the process: i.e. the percentage of the course before collagen deposition reaches its maximum level of tolerance, which in our case, was empirically found to be 32% of fibrosis. The magnitude of inflammation defines the current status (grading) of the disease process.
The aim of this study was to test the means of rapidly making standardized and precise metrical measurements of pathological elements in a liver biopsy histological section using the rules of measurement theory.
The model used to make quantitative comparisons between the structural elements of the natural liver system and the same elements in liver tissue affected by chronic viral inflammation was constructed on the basis of a set of four observables, which were considered the prime structural elements of the system. Three of these (the hepatocyte sub-set, topical immune system and collagen support network) were taken as axioms for measuring the purely structural organized matter; the fourth (tissue tectonics) was taken as an axiom because it defines the harmony that orders the natural conformation of liver tissue. Recognizing these observables in their most strictly structural form makes it possible to define necrosis, the topical immune system, the collagen network and tissue tectonics in geometrical terms: (1) necrosis of the hepatocyte mass was considered a reduction, and steatosis an enlargement due to lipid deposition in the form of intercellular vacuoles; (2) inflammation was considered an enlargement of the topical immune cell system; (3) fibrosis an enlargement of natural liver collagen formed by the deposition of intercellular matrix; and (4) the transformations in liver tectonics as a reduction in the natural harmonic state of liver tissue that caused disorder in the organ’s lobular structure.
This model allows the Dioguardi Histological Metriser to provide the following quantitative data: (1) the metrical extension of the residual hepatocellular set including the area of vacuoles pertinent to abnormal lipid accumulation; (2) the geometric measure of the inflammation basin (i.e. that part of the liver surface covered by inflammatory cell clusters), which distinguishes intra-basin space and extra-basin dispersed parenchymal leukocytes; (3) the magnitude of collagen islets, which were considered truncated or asymptotic planar fractals and classified into three degrees of magnitude; and (4) the TCI that quantifies alterations (disorders) in the organization of liver tissue.
To quantify these elements, the Dioguardi Histological Metriser uses three units of measurement. The first are the traditional IS units, which are used to measure the outlines of clusters and lipid vacuolization; the second are the traditional IS units corrected by the fractal dimension, which are used to measure irregular fractal collagen islets and the area of the residual hepatocellular set; and the third is the TCI, which is based on the inter-relationships between the Euclidean and fractal dimensions of liver tissue, and provides a quantitative estimate of the loss of natural tectonic order.
On the basis of our results, it is difficult not to consider biopsies a rich source of information regarding the course of chronic liver inflammation, despite their undeniable limitations[31]. Our perseverance in studying biopsies should be seen in the light of the risks[32-36] currently accepted in many fields of medical practice[37-39] (Table 7). Quantifying liver lesions in a biopsy sample raises many questions concerning the status and organization of natural and pathological liver systems that do not seem to be merely subsidiary matters to be dealt with within the confines of a specific investigation[1].
One fundamental question is whether hepatology researchers or practitioners need to adopt a metrical method of tissue analysis in order to confront the everyday problems they already solve in a less precise but what they still consider to be a satisfactory manner. Viral inflammation is a dynamic process influenced by a variety of factors that generate changes in the shapes (wrinkledness) of liver tissue lesions. However, studying the evolution of liver tissue status can use no more than one biopsy, which must therefore be examined in as much detail as possible, and this makes any attempt to improve precision crucial. It is clear that the status of the organ cannot be defined quantitatively without an appropriate technology that is capable of: (1) discriminating the most representative observables; (2) eliminating imprecise identifications and measurements; (3) using a suitable metrical unit for measuring the irregularly shaped elements of the tissue; (4) standardizing the measurement of previously unavailable histological elements; and (5) considering the smallest foci of inflammation and fibrotic islets that cannot be observed through an optical microscope.
The problem of the most representative observables was solved by the model, and that of the linear IS unit was solved by correcting it by the fractal dimension of the measured object[20,21]. The problem of standardizing the measurements was solved by constructing an innovative and completely automatic instrument that excludes human error, provides objective and reproducible results, and eliminates the need for the tedious work of light microscopic analysis (the automated analysis of an entire histological section takes place at a speed of 0.1 mm2/s).
The problem of the representativeness of a biopsy fragment (which accounts for only 1/40 000-1/60 000 of the whole liver)[12] cannot be directly solved by our method which, however, can ensure objective and mathematical precision in measuring elements that may or may not be visible through a microscope.
At this point it has to be stressed that, although our metrical measures are rigorous and reproducible, their scalars provide definitions of magnitude and not interpretations, which remain the responsibility of pathologists and clinicians.
However, our machine can already describe a histological picture in verbal and repeatable terms, and thus provide a strictly morphological diagnosis. We can also say that we have begun to consider it in terms that make it more comparable with an intelligent collaborator than a sophisticated desk computer. Finally, our data come from machine-made metrical measurements of the pathological observables in a histological pattern, and are not hypotheses based on semi-quantitative methods that can only continue to generate new hypotheses.
This paper is closed with a dedication to Robert Rosen.
Liver biopsy can be considered the gold standard for grading, staging and stad-ging the chronic liver disease. In addition, it remains a primary source for acquiring new knowledge about liver pathology.
This study introduced a new kind of liver biopsy measurement that bases the tissue state description on scalars, not with subjective interpretations (i.e. hypothesis). Furthermore, the Dioguardi Histological Metriser can describe a histological picture in verbal and repeatable terms, and thus provide a strictly morphological diagnosis.
The method, with opportune software, based on the same principles can be used for investigating also non-viral or inflammatory liver disease of other organs.
This paper reports an impressive method for automated biopsy scoring.
Peer reviewer: Mark D Gorrell, PhD, Professor, Centenary Institute of Cancer Medicine and Cell Biology, Locked bag No. 6, Newtown, NSW 2042, Australia
S- Editor Li DL L- Editor Kerr C E- Editor Ma WH
| 1. | Rosen R. Fundamentals of measurement and representation of natural systems. Elsevier Science Ltd. 1978;1-81. [Cited in This Article: ] |
| 2. | Desmet VJ, Roskams T. Cirrhosis reversal: a duel between dogma and myth. J Hepatol. 2004;40:860-867. [Cited in This Article: ] |
| 3. | Goodman ZD, Becker RL Jr, Pockros PJ, Afdhal NH. Progression of fibrosis in advanced chronic hepatitis C: evaluation by morphometric image analysis. Hepatology. 2007;45:886-894. [Cited in This Article: ] |
| 4. | Fontana RJ, Goodman ZD, Dienstag JL, Bonkovsky HL, Naishadham D, Sterling RK, Su GL, Ghosh M, Wright EC. Relationship of serum fibrosis markers with liver fibrosis stage and collagen content in patients with advanced chronic hepatitis C. Hepatology. 2008;47:789-798. [Cited in This Article: ] |
| 5. | Sandrin L, Fourquet B, Hasquenoph JM, Yon S, Fournier C, Mal F, Christidis C, Ziol M, Poulet B, Kazemi F. Transient elastography: a new noninvasive method for assessment of hepatic fibrosis. Ultrasound Med Biol. 2003;29:1705-1713. [Cited in This Article: ] |
| 6. | Ziol M, Handra-Luca A, Kettaneh A, Christidis C, Mal F, Kazemi F, de Ledinghen V, Marcellin P, Dhumeaux D, Trinchet JC. Noninvasive assessment of liver fibrosis by measurement of stiffness in patients with chronic hepatitis C. Hepatology. 2005;41:48-54. [Cited in This Article: ] |
| 7. | Poynard T, Imbert-Bismut F, Munteanu M, Messous D, Myers RP, Thabut D, Ratziu V, Mercadier A, Benhamou Y, Hainque B. Overview of the diagnostic value of biochemical markers of liver fibrosis (FibroTest, HCV FibroSure) and necrosis (ActiTest) in patients with chronic hepatitis C. Comp Hepatol. 2004;3:8. [Cited in This Article: ] |
| 8. | Rosenberg WM, Voelker M, Thiel R, Becka M, Burt A, Schuppan D, Hubscher S, Roskams T, Pinzani M, Arthur MJ. Serum markers detect the presence of liver fibrosis: a cohort study. Gastroenterology. 2004;127:1704-1713. [Cited in This Article: ] |
| 9. | Patel K, Gordon SC, Jacobson I, Hezode C, Oh E, Smith KM, Pawlotsky JM, McHutchison JG. Evaluation of a panel of non-invasive serum markers to differentiate mild from moderate-to-advanced liver fibrosis in chronic hepatitis C patients. J Hepatol. 2004;41:935-942. [Cited in This Article: ] |
| 10. | Imbert-Bismut F, Ratziu V, Pieroni L, Charlotte F, Benhamou Y, Poynard T. Biochemical markers of liver fibrosis in patients with hepatitis C virus infection: a prospective study. Lancet. 2001;357:1069-1075. [Cited in This Article: ] |
| 11. | Afdhal NH. Biopsy or biomarkers: is there a gold standard for diagnosis of liver fibrosis? Clin Chem. 2004;50:1299-1300. [Cited in This Article: ] |
| 12. | Bravo AA, Sheth SG, Chopra S. Liver biopsy. N Engl J Med. 2001;344:495-500. [Cited in This Article: ] |
| 13. | Kage M, Shimamatu K, Nakashima E, Kojiro M, Inoue O, Yano M. Long-term evolution of fibrosis from chronic hepatitis to cirrhosis in patients with hepatitis C: morphometric analysis of repeated biopsies. Hepatology. 1997;25:1028-1031. [Cited in This Article: ] |
| 14. | Masseroli M, Caballero T, O’Valle F, Del Moral RM, Perez-Milena A, Del Moral RG. Automatic quantification of liver fibrosis: design and validation of a new image analysis method: comparison with semi-quantitative indexes of fibrosis. J Hepatol. 2000;32:453-464. [Cited in This Article: ] |
| 15. | Pilette C, Rousselet MC, Bedossa P, Chappard D, Oberti F, Rifflet H, Maiga MY, Gallois Y, Cales P. Histopathological evaluation of liver fibrosis: quantitative image analysis vs semi-quantitative scores. Comparison with serum markers. J Hepatol. 1998;28:439-446. [Cited in This Article: ] |
| 16. | Matalka II, Al-Jarrah OM, Manasrah TM. Quantitative assessment of liver fibrosis: a novel automated image analysis method. Liver Int. 2006;26:1054-1064. [Cited in This Article: ] |
| 17. | Wright M, Thursz M, Pullen R, Thomas H, Goldin R. Quantitative versus morphological assessment of liver fibrosis: semi-quantitative scores are more robust than digital image fibrosis area estimation. Liver Int. 2003;23:28-34. [Cited in This Article: ] |
| 18. | Friedenberg MA, Miller L, Chung CY, Fleszler F, Banson FL, Thomas R, Swartz KP, Friedenberg FK. Simplified method of hepatic fibrosis quantification: design of a new morphometric analysis application. Liver Int. 2005;25:1156-1161. [Cited in This Article: ] |
| 19. | Arima M, Terao H, Kashima K, Arita T, Nasu M, Nishizono A. Regression of liver fibrosis in cases of chronic liver disease type C: quantitative evaluation by using computed image analysis. Intern Med. 2004;43:902-910. [Cited in This Article: ] |
| 20. | Dioguardi N, Franceschini B, Aletti G, Russo C, Grizzi F. Fractal dimension rectified meter for quantification of liver fibrosis and other irregular microscopic objects. Anal Quant Cytol Histol. 2003;25:312-320. [Cited in This Article: ] |
| 21. | Dioguardi N, Grizzi F, Franceschini B, Bossi P, Russo C. Liver fibrosis and tissue architectural change measurement using fractal-rectified metrics and Hurst’s exponent. World J Gastroenterol. 2006;12:2187-2194. [Cited in This Article: ] |
| 22. | Mandelbrot BB. The fractal geometry of the nature. San Francisco: Freeman 1982; 21-44. [Cited in This Article: ] |
| 23. | Dioguardi N, Franceschini B, Russo C, Grizzi F. Computer-aided morphometry of liver inflammation in needle biopsies. World J Gastroenterol. 2005;11:6995-7000. [Cited in This Article: ] |
| 24. | Knodell RG, Ishak KG, Black WC, Chen TS, Craig R, Kaplowitz N, Kiernan TW, Wollman J. Formulation and application of a numerical scoring system for assessing histological activity in asymptomatic chronic active hepatitis. Hepatology. 1981;1:431-435. [Cited in This Article: ] |
| 25. | Scheuer PJ. Classification of chronic viral hepatitis: a need for reassessment. J Hepatol. 1991;13:372-374. [Cited in This Article: ] |
| 26. | Ishak K, Baptista A, Bianchi L, Callea F, De Groote J, Gudat F, Denk H, Desmet V, Korb G, MacSween RN. Histological grading and staging of chronic hepatitis. J Hepatol. 1995;22:696-699. [Cited in This Article: ] |
| 27. | Bedossa P, Poynard T. An algorithm for the grading of activity in chronic hepatitis C. The METAVIR Cooperative Study Group. Hepatology. 1996;24:289-293. [Cited in This Article: ] |
| 28. | Bassingthwaighte JB, Liebovitch LS, West BJ. Fractal physiology. New York: Oxford University Press 1994; 11-44. [Cited in This Article: ] |
| 29. | Hastings HM, Sugihara G. Fractals. A user's guide for the natural sciences. Oxford: Oxford Science Publications 1993; 36-55. [Cited in This Article: ] |
| 30. | Rigaut JP, Schoevaert-Brossault D, Downs AM, Landini G. Asymptotic fractals in the context of grey-scale images. J Microsc. 1998;189:57-63. [Cited in This Article: ] |
| 31. | Kumar P, Clark M. Clinical medicine. WB Saunders. Oxford: Oxford Science Publications 1998; 296-297. [Cited in This Article: ] |
| 32. | Tierney LM, McPhee SJ, Papadakis MA. Current medical diagnosis & treatment. McGraw-Hill. Oxford: Oxford Science Publications 2002; 571-673. [Cited in This Article: ] |
| 33. | Janes SE, Cowan IA, Dijkstra B. A life threatening complication after colonoscopy. BMJ. 2005;330:889-890. [Cited in This Article: ] |
| 34. | Levin TR, Farraye FA, Schoen RE, Hoff G, Atkin W, Bond JH, Winawer S, Burt RW, Johnson DA, Kirk LM. Quality in the technical performance of screening flexible sigmoidoscopy: recommendations of an international multi-society task group. Gut. 2005;54:807-813. [Cited in This Article: ] |
| 35. | Freeman ML, Nelson DB, Sherman S, Haber GB, Herman ME, Dorsher PJ, Moore JP, Fennerty MB, Ryan ME, Shaw MJ. Complications of endoscopic biliary sphincterotomy. N Engl J Med. 1996;335:909-918. [Cited in This Article: ] |
| 36. | Baillie J. ERCP training: for the few, not for all. Gut. 1999;45:9-10. [Cited in This Article: ] |
| 37. | Kandzari DE, Rebeiz AG, Wang A, Sketch MH Jr. Contrast nephropathy : an evidence-based approach to prevention. Am J Cardiovasc Drugs. 2003;3:395-405. [Cited in This Article: ] |
| 38. | Sakai N, Sendo T, Itoh Y, Hirakawa Y, Takeshita A, Oishi R. Delayed adverse reactions to iodinated radiographic contrast media after coronary angiography: a search for possible risk factors. J Clin Pharm Ther. 2003;28:505-512. [Cited in This Article: ] |
| 39. | Panto PN, Davies P. Delayed reactions to urographic contrast media. Br J Radiol. 1986;59:41-44. [Cited in This Article: ] |


