Copyright
©2008 The WJG Press and Baishideng.
World J Gastroenterol. Jan 28, 2008; 14(4): 511-517
Published online Jan 28, 2008. doi: 10.3748/wjg.14.511
Published online Jan 28, 2008. doi: 10.3748/wjg.14.511
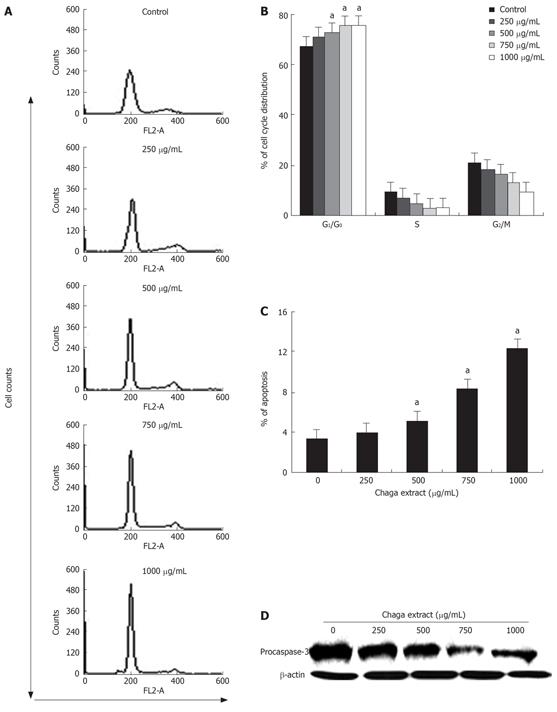
Figure 2 Apoptotic cell death of HepG2 by Chaga extract.
The effect of Chaga extract on cell cycle progression of HepG2 cells was determined. HepG2 cells were treated with various doses of Chaga extract for 48 h. Then, cells were harvested and washed with cold PBS. A: Cellular DNA content was stained with PI solution and flow cytometric analysis was performed to analyze the cell cycle distribution. Cell cycle histogram was shown; B: A summary of cell cycle distribution data in histograms. Data represented as means ± SD of three independent experiments. aP < 0.05, vs control cells; C: The percentage of subG0/G1 phase was represented as % of apoptosis. Data represented as means ± SD of three independent experiments. aP < 0.05 vs control cells; D: Caspase-3 activation, which was measured by cleavage of procaspase-3, in Chaga extract-treated HepG2 cells was determined by western blot analysis.
-
Citation: Youn MJ, Kim JK, Park SY, Kim Y, Kim SJ, Lee JS, Chai KY, Kim HJ, Cui MX, So HS, Kim KY, Park R. Chaga mushroom (
Inonotus obliquus ) induces G0/G1 arrest and apoptosis in human hepatoma HepG2 cells. World J Gastroenterol 2008; 14(4): 511-517 - URL: https://www.wjgnet.com/1007-9327/full/v14/i4/511.htm
- DOI: https://dx.doi.org/10.3748/wjg.14.511


