Published online Jan 14, 2008. doi: 10.3748/wjg.14.236
Revised: October 9, 2007
Published online: January 14, 2008
AIM: To evaluate whether serum levels of nitric oxide (NO•) and plasma levels of cyclic guanosine monophosphate (cGMP) and total glutathione (GSH) are altered in patients with alcoholic cirrhosis and to examine their correlation with the severity of liver disease.
METHODS: Twenty-six patients with alcoholic liver cirrhosis were studied. Serum levels of NO• and plasma levels of cGMP and GSH were measured in 7 patients with compensated alcoholic cirrhosis (Child-Pugh A) and 19 patients with advanced cirrhosis (Child-Pugh B and C). The model for end-stage liver disease (MELD) score was evaluated. Sixteen healthy volunteers served as controls. Liver enzymes and creatinine levels were also tested.
RESULTS: NO• and cGMP levels were higher in patients with Child-Pugh B and C cirrhosis than in Child-Pugh A cirrhosis or controls (NO•: 21.70 ± 8.07 vs 11.70 ± 2.74; 21.70 ± 8.07 vs 7.26 ± 2.47 &mgr;mol/L, respectively; P < 0.001) and (cGMP: 20.12 ± 6.62 vs 10.14 ± 2.78; 20.12 ± 6.62 vs 4.95 ± 1.21 pmol/L, respectively; P < 0.001). Total glutathione levels were lower in patients with Child-Pugh B and C cirrhosis than in patients with Child-Pugh A cirrhosis or controls (16.04 ± 6.06 vs 23.01 ± 4.38 or 16.04 ± 6.06 vs 66.57 ± 26.23 &mgr;mol/L, respectively; P < 0.001). There was a significant correlation between NO• and cGMP levels in all patients with alcoholic cirrhosis. A significant negative correlation between reduced glutathione/glutathione disulfide and the MELD score was found in all cirrhotic patients.
CONCLUSION: Our results suggest a role for oxidative stress in alcoholic liver cirrhosis, which is more significant in decompensated patients with higher levels of NO• and cGMP and lower GSH levels than in compensated and control patients. Altered mediator levels in decompensated patients may influence the hemodynamic changes in and progression of liver disease.
- Citation: Siqueira C, Moura MC, Pedro AJ, Rocha P. Elevated nitric oxide and 3’,5’ cyclic guanosine monophosphate levels in patients with alcoholic cirrhosis. World J Gastroenterol 2008; 14(2): 236-242
- URL: https://www.wjgnet.com/1007-9327/full/v14/i2/236.htm
- DOI: https://dx.doi.org/10.3748/wjg.14.236
Increased production of free radicals has been implicated in several conditions, such as liver damage and fibrosis[1]. Free radicals can damage cellular macromolecules and, therefore, may participate in hepatocellular injury when produced in excess. Endotoxins or cytokines induce macrophages, neutrophils and vascular smooth muscle cells to express a calcium-independent isoform of nitric oxide synthase (NOS). Nitric oxide (NO•) is a messenger molecule that functions as a vasodilator and accounts for the biological activity of endothelium-derived relaxing factor (EDRF)[2–4]. The three isoforms of nitric oxide synthase (NOS), the enzyme responsible for the generation of NO•, are all found in the liver[4].
Production of NO• activates the soluble guanylate cyclase (sGC) the enzyme with a prosthetic heme group by binding to the ferrous heme iron (Fe2+), resulting in the formation of cyclic guanosine 3’-5’ monophosphate (cGMP) from guanosine 5’ triphosphate (GTP). This process occurs in both endothelial and vascular smooth muscle cells[56]. The increase in concentrations of the second messenger cGMP is stimulated by activation of dependent protein-kinase G (pKG) and confers signalling capacity to the free radical via NO•-sGC-cGMP-PKG pathway, which in turns leads to the relaxation or dilation of vascular smooth muscle cells (VSMCs), and, subsequently, to inflammation and tissue damage mediated by reactive oxygen species (ROS; for example, O2-• and OH•).
NO• promotes tissue toxicity when it reacts with the superoxide anion radical (O2-•), which leads to formation of peroxinitrite anion (ONOO-) and hydroxyl radical (OH•)[6–9] (NO• + O2-•→ONOO- + OH•). Both of these products OH• and ONOO- are aggressive free radicals and powerful oxidants that can cause membrane lipid peroxidation[5–710]. Antioxidants are substances that help to reduce the severity of oxidant stress either by contributing to the formation of a less active radical or by quenching the reaction of NO• which produce peroxinitrite anion and hydroxyl radical. Glutathione (GSH) and its related enzymes are protective effects against oxidative damage[11]. One consequence of GSH depletion, as seen during redox stress, would be enhanced peroxinitrite formation. Glutathione may also be involved in the detoxification of peroxinitrite. Both O2-• and OH• increase production of ROS and GSH depletion, which leads to the abnormal breakdown of fat molecules (that is, lipid peroxidation). This complex process results in the formation of toxic compounds and may contribute to the pathogenesis of alcoholic liver injury.
The aim of this study was to investigate whether serum levels of NO• and 3’,5’cyclic guanosine monophosphate (cGMP), and plasma levels of thiol-reduced glutathione (GSHr) and glutathione disulfide (GSSG), are altered in patients with alcoholic liver cirrhosis, and to assess their possible correlation with the severity of liver disease, measured by the Child-Pugh and MELD scores.
This study was performed in 26 patients with alcoholic cirrhosis (19 men and 7 women, mean age 56.00 ± 12 years) admitted to the Liver Unit and Division of Gastroenterology, Santa Maria Hospital for evaluation. All patients had a history of alcoholic consumption greater than 80 g/d for at least 5 years. The diagnosis of liver cirrhosis was based on clinical, biochemical and ultrasonographic findings or histological criteria. The patients were classified as having compensated (n = 7) or decompensated liver cirrhosis (n = 19). According to the Child-Pugh scores, all compensated patients belonged to class A. The decompensated group consisted of 8 patients in class C and 11 patients in class B with a Child-Pugh score above 8. At the time of the study no Child A patients showed clinical features of decompensated liver cirrhosis (ascites, edema, encephalopathy or recent portal hypertension associated gastrointestinal bleeding). All patients graded Child-Pugh B-C had moderate to severe ascites without evidence of infection. The main clinical and laboratory findings are shown in Table 1. There was no evidence of hepatocellular carcinoma, cardiac, renal or respiratory failure in the patients studied, and none of them were administered vasoactive drugs or antioxidants during the study.
| Child-Pugh A (n = 7) | Child-Pugh B (n = 11) | Child-Pugh C (n = 8) | Reference values | |
| LDH U/L | 403.71 ± 115.32 | 453.80 ± 126.10 | 369.25 ± 151.89 | 240-480 |
| AST U/L | 59.57 ± 51.56 | 109.20 ± 97 | 88.88 ± 97.81 | 0-31 |
| ALT U/L | 40.86 ± 27.39 | 58.50 ± 47.58 | 43.63 ± 47.43 | 0-31 |
| γGT U/L | 271 ± 190.32 | 280.12 ± 237.87 | 196.75 ± 160.35 | 5-36 |
| AP U/L | 134.57 ± 77.62 | 99 ± 24.61 | 103.88 ± 44.25 | 35-104 |
| Leukocytes/&mgr;L | 5784.29 ± 1677.52 | 7429 ± 3987.49 | 5731.25 ± 2187.02 | 4000-11000 |
| Neutrophils/&mgr;L | 3289.14 ± 1987.81 | 4424 ± 3042.67 | 3555 ± 1781.55 | 1900-7500 |
| Creatinine mg/dL | 1.17 ± 0.47 | 1.41 ± 0.54 | 1.91 ± 0.61 | 0.7-1.1 |
| Bilirubin mg/dL | 1.06 ± 0.10 | 1.56 ± 0.88 | 2.45 ± 1.37 | 0.1-1.1 |
| INR | 1.02 ± 0.10 | 1.54 ± 0.71 | 2.59 ± 0.99 | 0.8-1.1 |
| MELD | 8.29 ± 2.75 | 16.10 ± 6.77 | 23.38 ± 7.09 | 6-8 |
The control group consisted of 16 healthy subjects (10 men and 6 women, mean age 38 ± 18 years) with normal laboratory findings. Informed consent to participate in the study was obtained from each patient.
Peripheral venous blood from fasted healthy volunteers and fasted cirrhotic patients was collected in separate tubes, one containing the anticoagulant ethylenediamine tetraacetic disodium (Na2EDTA) and the other without serum anticoagulant. The blood was allowed to clot for 30 min at 25°C, centrifuged at 2000 ×g for 15 min at room temperature, and the serum was then separated and aliquoted into tubes for storage. To obtain plasma samples, the blood was centrifuged immediately at 2000 ×g for 10 min at 4°C, and then aliquoted into tubes. The tubes were then stored frozen at -80°C until they were used to study different biomarkers.
Determination of NOx levels: The level of serum NO• was obtained indirectly by measuring the levels of its metabolites nitrate (NO3-) and nitrite (NO2-). The levels of the final products of NO• oxidation (NO3- and NO2-) were assessed using the Griess reaction. NO3- was enzymatically converted into NO2- in the presence of reduced nicotinamide adenine dinucleotide phosphate (NADPH), flavine adenine dinucleotide (FAD) and nitrate reductase. Nitrite reacts with Griess reagent (1 g/L sulphanilamide 0.1 g/L N-(1-naphtyl)-ethylenediamine and 5 g/L phosphoric acid) to give a red-violet diazo dye. The determination of these two elements (NO3- and NO2-) was measured in triplicate in a microplate reader on the basis of absorbance in the visible range at 540 nm. The concentrations of NO2- were determined from a calibration curve obtained using standard NO2- solutions. The mean values of the measurements were taken as the final result. The limit of detection of the method is 0.28 &mgr;mol/L for nitrate and 0.32 &mgr;mol/L for nitrite.
Determination of cGMP: The plasma concentration of cGMP was determined in duplicate by radioimmunoassay (RIA) using a commercial kit according to the manufacturer’s protocol (IBL Hamburg, Germany).
Determination of GSHt, GSSG and GSHr: For 1 mL of plasma was used (50 &mgr;L of 5% sulphosalicylic acid) to prevent spontaneous oxidation of GSH. After centrifugation at 2000 ×g for 10 min, 100 &mgr;L of the supernatant was removed for assay of GSH.
The sulfhydryl group of GSH reacts with Ellman’s reagent, 5,5’-dithio-bis-(2-nitrobenzoic acid) (DTNB) to produce yellow 5-thio-2-nitrobenzoic acid (TNB). The mixed disulfide, GS-TNB (between GSH and TNB) is subsequently reduced by glutathione reductase and the reduced form of β-nicotinamide adenine dinucleotide phosphate (NADPH), releasing a second TNB molecule and recycling the GSH. The rate of TNB production is directly proportional to this recycling reaction, which, in turn, is directly proportional to the concentration of GSH in the sample. GSH is easily oxidized to GSSG by glutathione reductase (GR), according to the following formula:
GSSG + NAD (P) H→ GSH + NADP+.
The concentrations of GSHr and GSSG in plasma were determined from a calibration curve using standard GSHr and GSSG solutions. Both GSHr and GSSG were measured in duplicate in a microplate reader on the basis of absorbance in the visible range at 405 nm.
Total GSHt is equivalent to the sum of GSSG and GSHr.
MELD score: The model for end-stage liver disease (MELD) score was calculated from the following equation:
9.57 × loge (creatinine mg/dL) + 3.78 × loge (bilirubine mg/dL) + 11.2 × loge (INR) + 6.43.
The maximal creatinine level considered in the MELD score is 4.0 mg/dL[12].
Statistical analyses were performed using the SPSS 12.0 statistical package (SPSS Inc., Chicago). All results are expressed as means ± SD, median values and ranges. Data were analysed by one-way analysis of variance in addition to the Student-Newman-Keuls post-hoc test. Coefficient correlations were evaluated using the linear regression analysis or Pearson correlation. Statistical significance was established at P < 0.05.
The baseline laboratory characteristics of the 26 patients with alcoholic liver cirrhosis (classified as Child-Pugh A, B and C) are shown in Table 1. The concentrations of serum NO• and the different plasma biomarkers in the cirrhotic patients and controls are shown in Table 2. There were statistically significant differences between the 4 groups. The minimum NO• level obtained in the control group was 3.19 &mgr;mol/L.
| Biomarkers | Controls (n = 16) | Child-Pugh A (n = 7) | Child-Pugh B and C (n = 19) | P values |
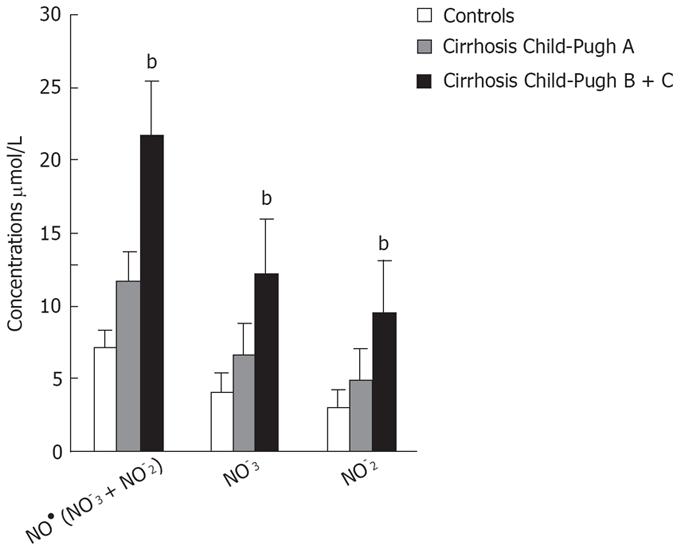
| NO3-&mgr;mol/L | 4.16 ± 1.36; (4.21) | 6.73 ± 1.32; (6.89) | 12.23 ± 4.29; (11.79) | b < 0.001; a < 0.05 |
| NO2-&mgr;mol/L | 3.10 ± 1.27; (2.90) | 4.97 ± 1.5; (5.76) | 9.46 ± 3.93; (7.80) | b < 0.001; a < 0.05 |
| NO• (NO3- + NO2-) &mgr;mol/L | 7.26 ± 2.47; (7.31) | 11.70 ± 2.74; (12.72) | 21.70 ± 8.07; (18.22) | b < 0.001; a < 0.05 |
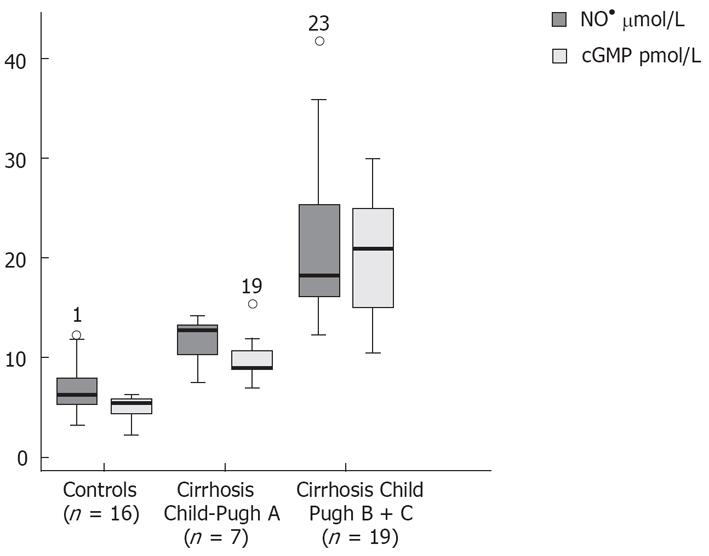
| cGMP pmol/L | 4.95 ± 1.21; (5.39) | 10.14 ± 2.78; (9.0) | 20.12 ± 6.62; (21.00) | b < 0.001; a < 0.05 |
| GSHt &mgr;mol/L | 66.57 ± 26.23; (59.88) | 23.01 ± 4.38; (22.82) | 16.04 ± 6.06; (14.30) | b < 0.001; a < 0.05 |
| GSSG &mgr;mol/L | 18.57 ± 6.39; (18.57) | 9.43 ± 2.3; (9.65) | 9.47 ± 4.17; (8.13) | b < 0.001; a < 0.05 |
| GSHr &mgr;mol/L | 47.78 ± 23.63; (45.19) | 13.58 ± 3.7; (13.88) | 6.54 ± 3.31; (6.02) | b < 0.001; a < 0.05 |
| GSHr/GSSG | 2.68 ± 1.16; (2.95) | 1.52 ± 0.63; (1.50) | 0.81 ± 0.42; (0.58) | b < 0.001; a < 0.05 |
| MELD | 6-8 | 8.29 ± 2.75; (8.00) | 20.17 ± 8.45; (20.00). | b = 0.001; a < 0.05 |
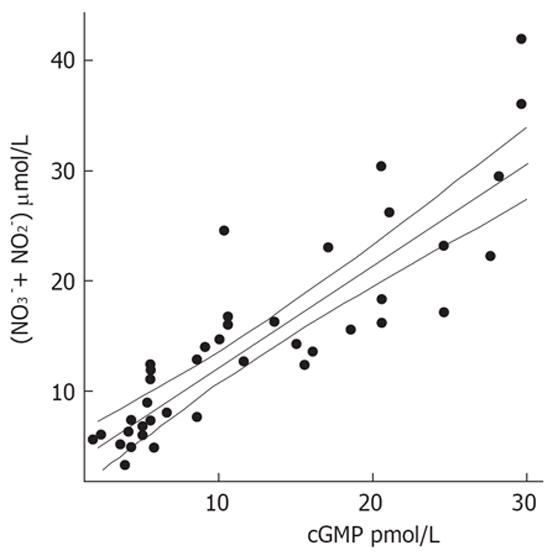
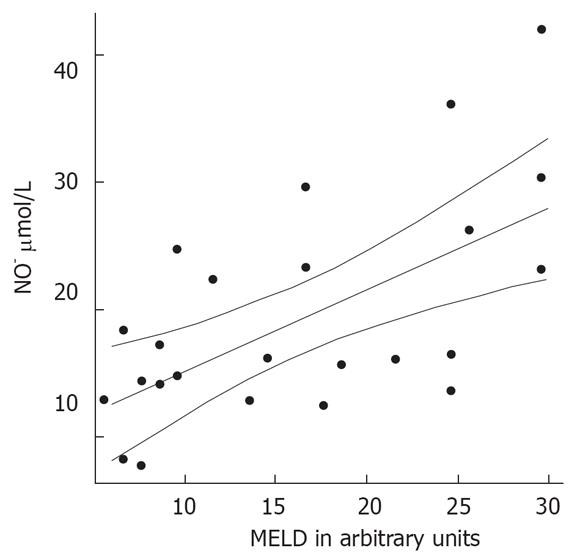
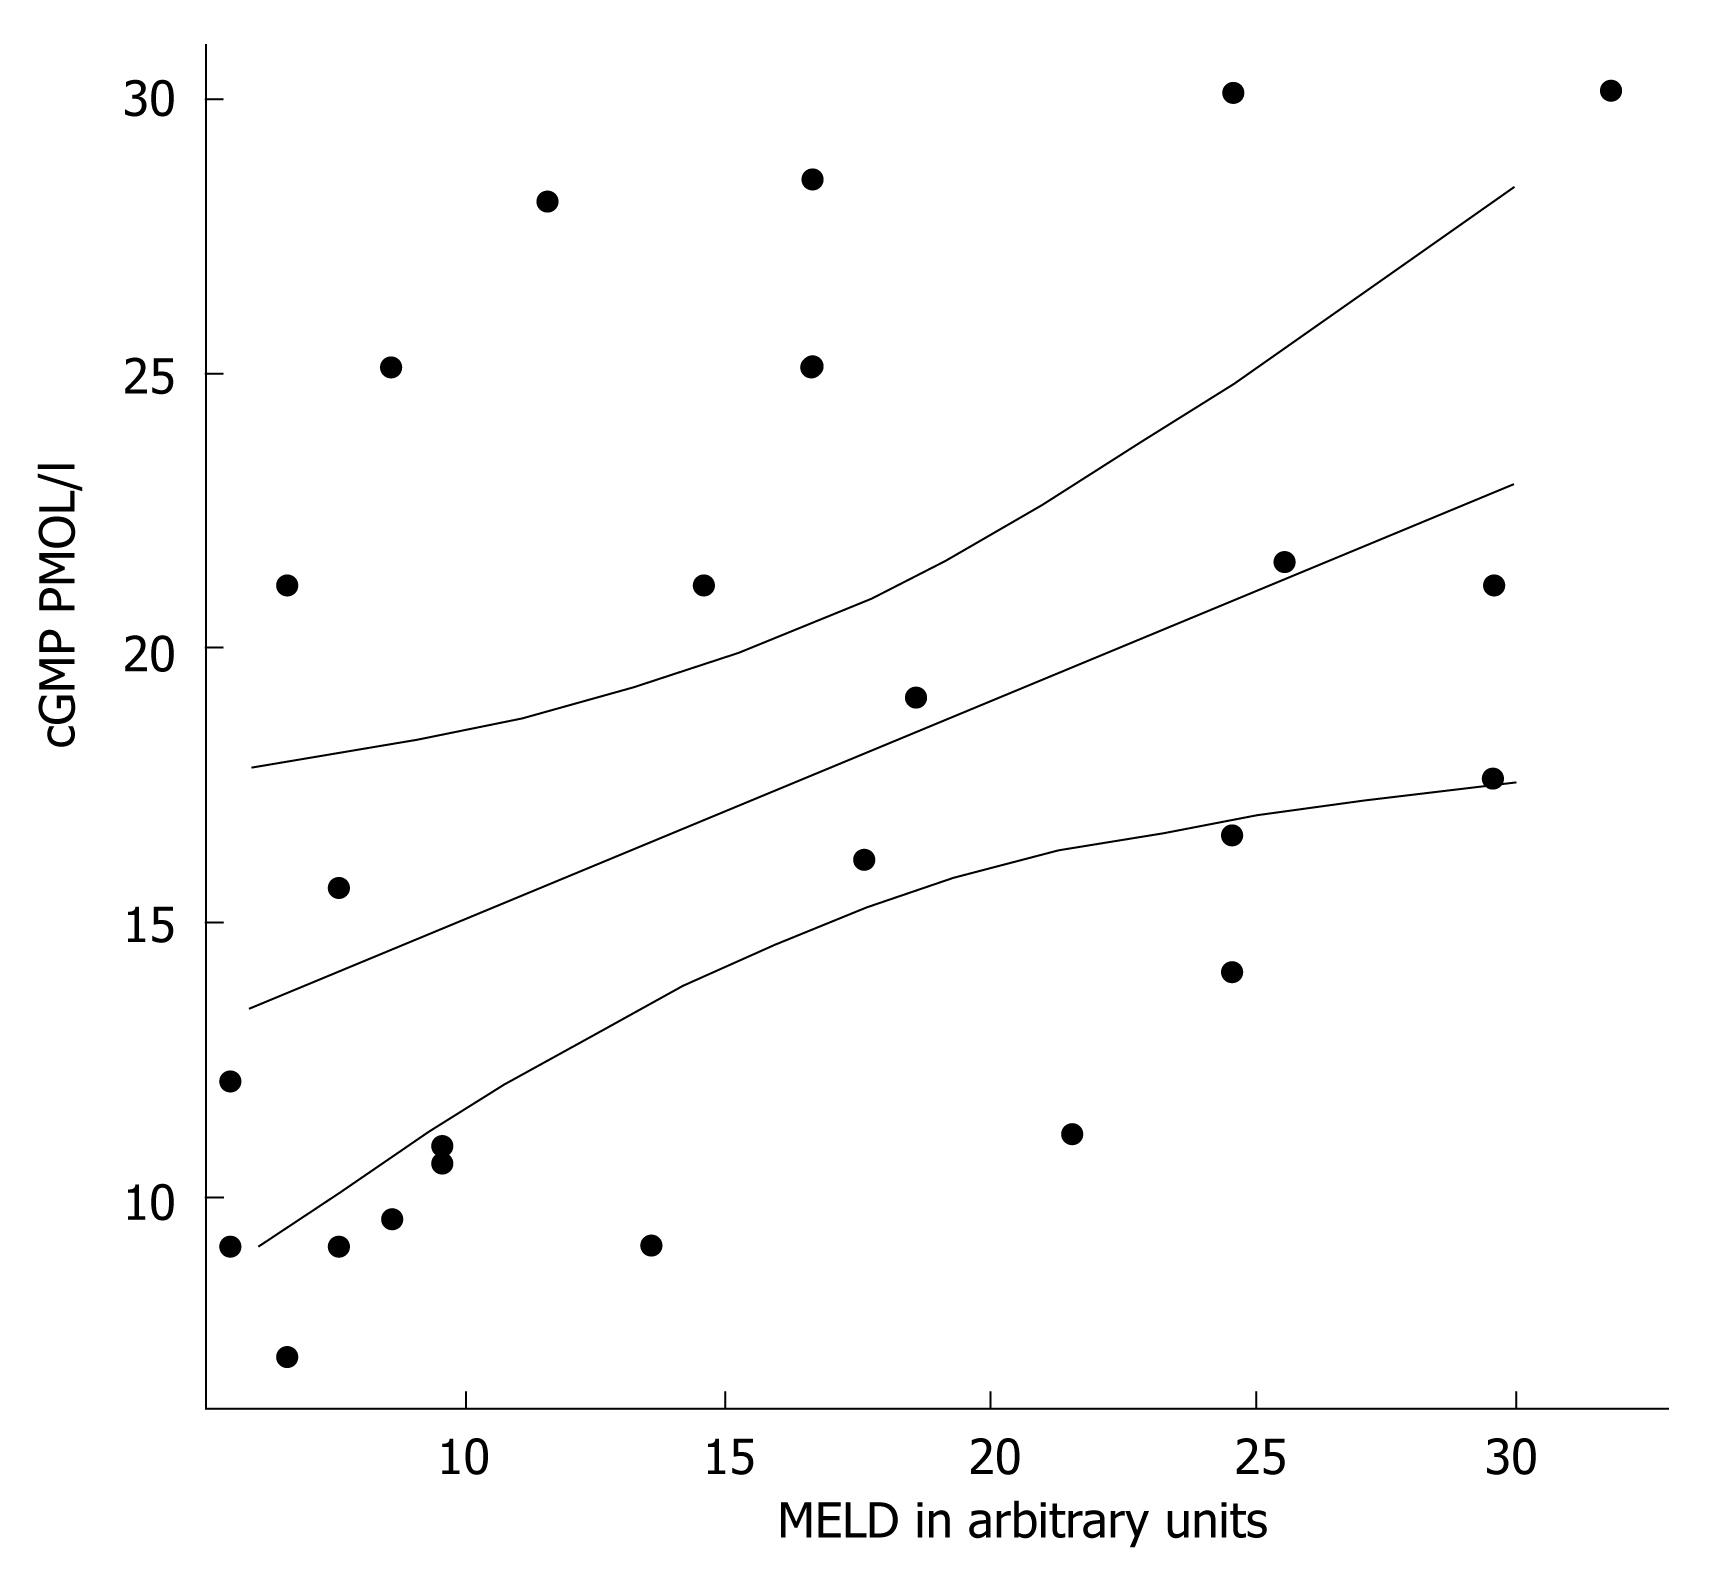
Patients with decompensated liver cirrhosis (Child-Pugh B and C) exhibited significantly higher serum concentrations of NO• than both patients with compensated liver cirrhosis (Child-Pugh A) and controls (Figure 1). There was a significant difference in serum NO• concentrations between control subjects and compensated liver cirrhotic patients. The concentrations of plasma cGMP in patients with decompensated cirrhosis were higher than in those in compensated cirrhosis, and this difference was statistically significant (P < 0.001). The concentrations of plasma cGMP in patients with compensated liver cirrhosis were higher when compared with those with the controls and this difference was statistically significant (P < 0.001) (Figure 2). Significant correlations between NO• and cGMP levels (r = 0.866, P < 0.001), between NO• levels and MELD scores (r = 0.627, P < 0.01) and between cGMP levels and MELD scores (r = 0.452, P < 0.05) were observed among the 26 alcoholic liver cirrhotic patients (Figure 3, 4 and 5).
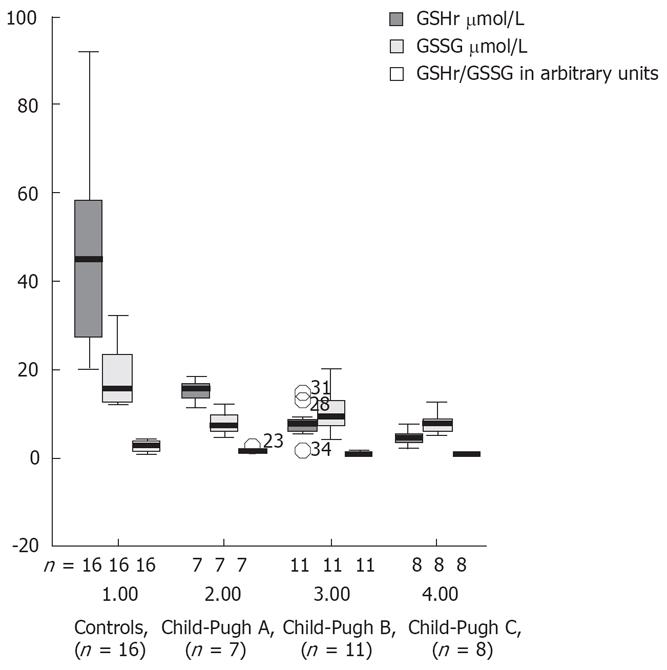
Decreases in the plasma levels of GSHt, GSSG and GSHr were observed in all alcoholic liver cirrhotic patients, when compared with controls (Table 2). This decrease in GSHr levels was most prominent in decompensated liver cirrhotic patients. Figure 6 shows the plasma levels of the biomarkers of oxidative stress (GSHr, GSSG and GSHr/GSSG) in controls and in plasma of cirrhotic patients Child-Pugh classes A, B and C. There was a markedly reduced ratio GSHr/GSSG in patients with Child-Pugh B and C cirrhosis compared with patients with Child-Pugh A cirrhosis or controls (P < 0.001). The GSHr levels were higher in the controls than in the cirrhotic patients stratified according to Child-Pugh score.
The GSSG levels were higher in patients with Child-Pugh B and C cirrhosis than in those with Child-Pugh A cirrhosis or controls. The ratio between GSHr/GSSG was lower in patients with Child-Pugh B and C cirrhosis than in those with Child-Pugh A.
No correlation between NO• and cGMP levels and creatinine levels was found in patients with decompensated cirrhosis.
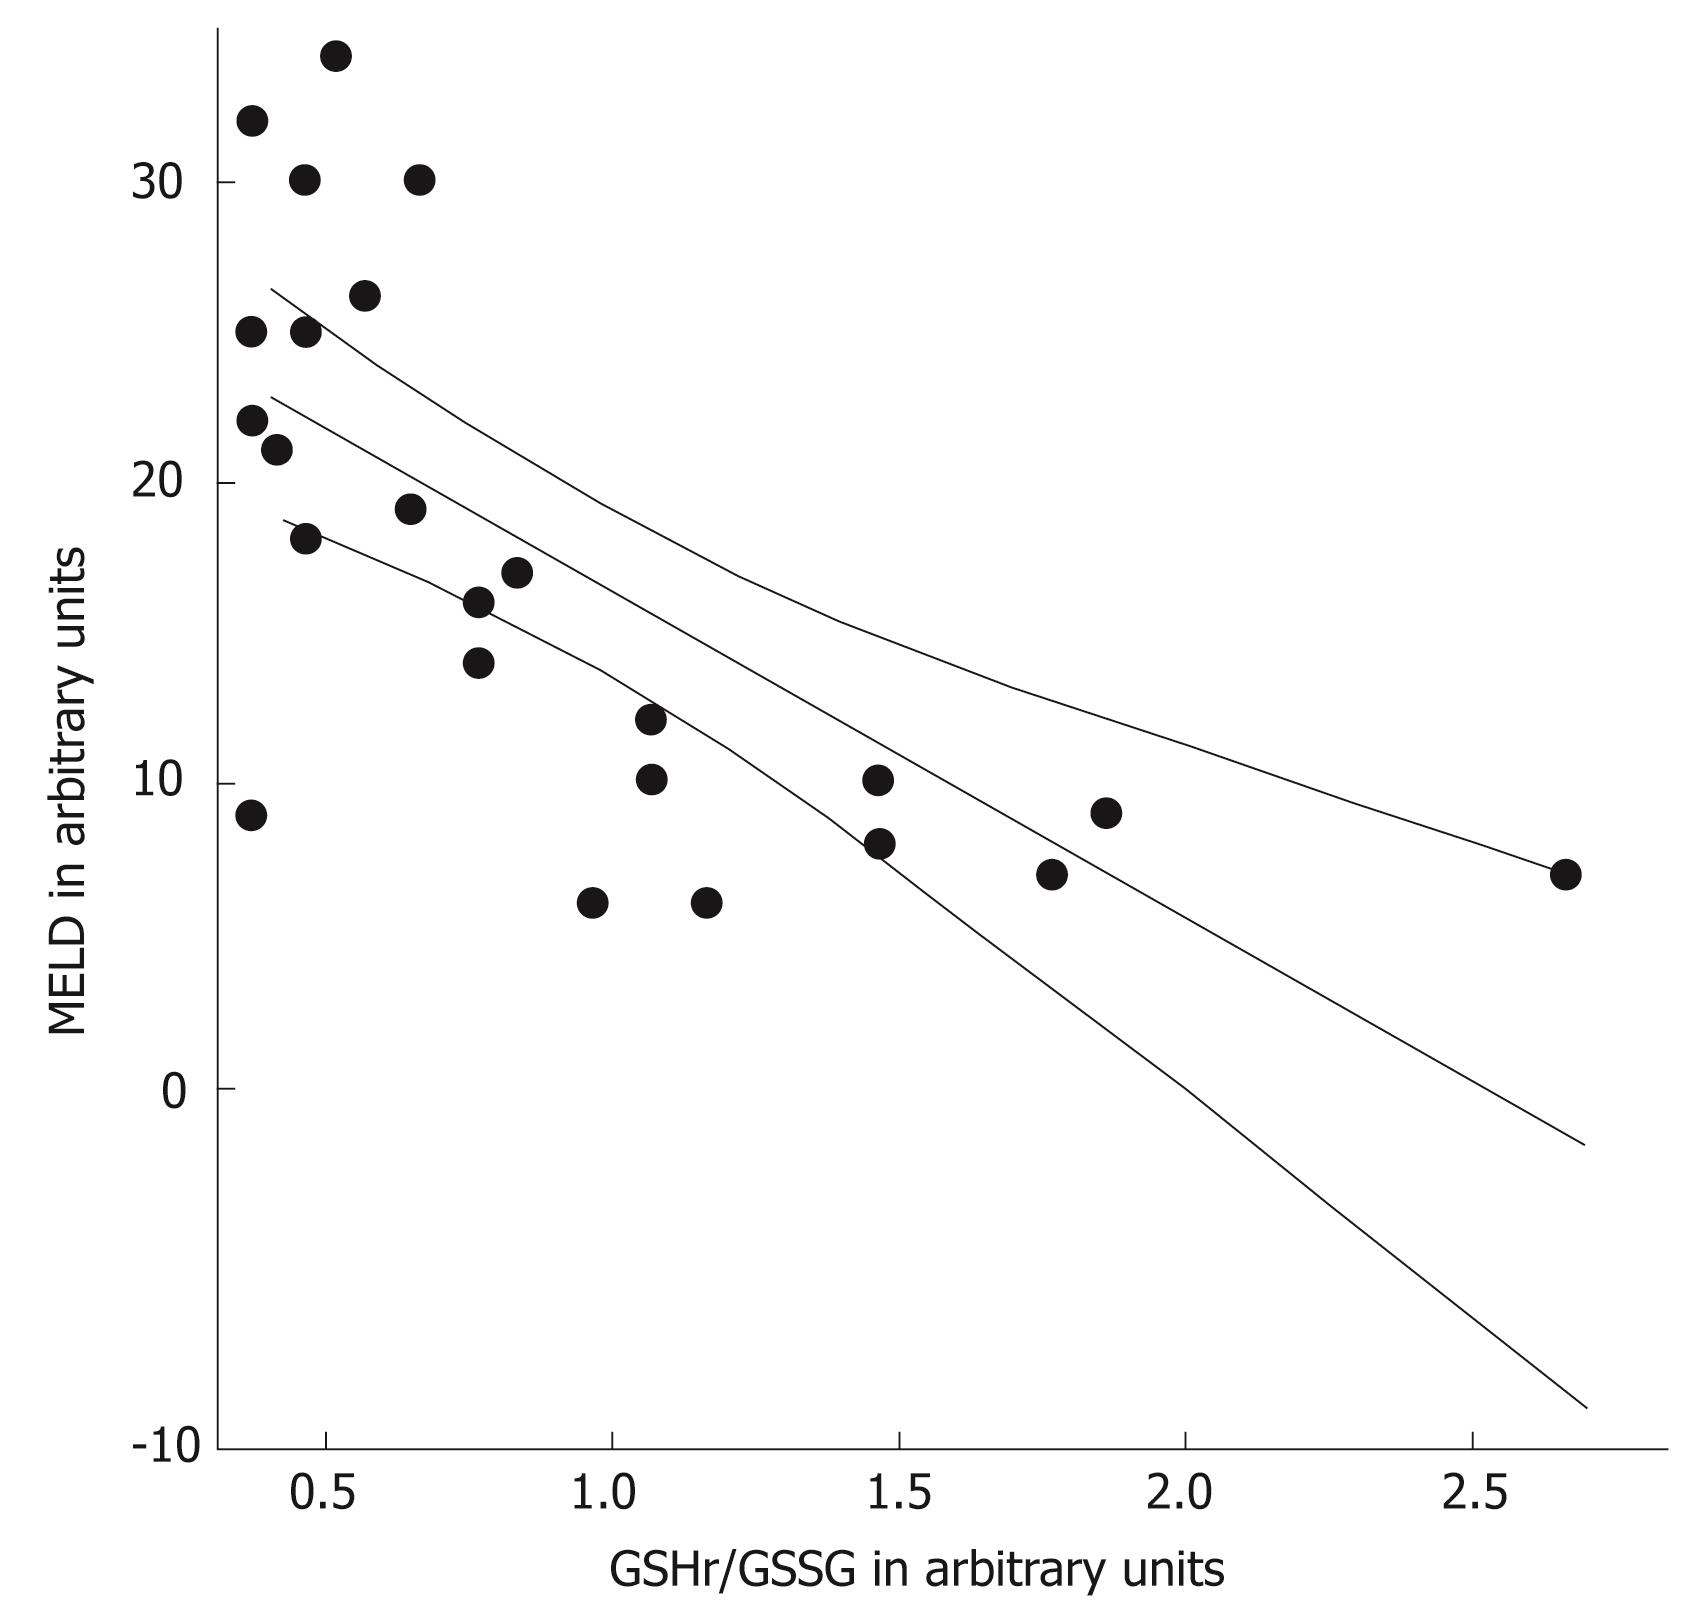
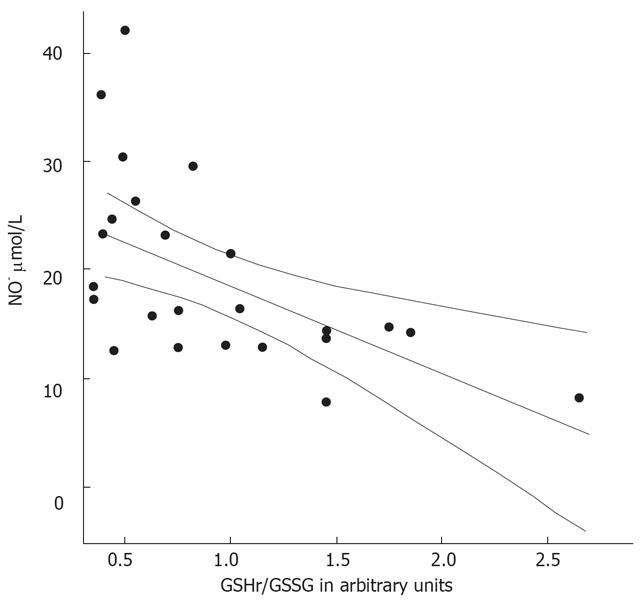
The MELD scores were determined in the 26 patients with alcoholic cirrhosis (Table 2). These was higher in the decompensated patients than in the compensated cirrhotic patients (P < 0.001). The GSHr/GSSG ratios were lower in cirrhotic patients belonging to Child-Pugh class B and C compared with those in Child-Pugh class A. Significant negative correlations between the MELD score and the GSHr/GSSG ratio (r = -0.693, P < 0.001) and between NO• level and the GSHr/GSSG ratio (r = -0.558, P < 0.01) were found in all of the alcoholic cirrhotic patients, as shown in Figure 7 and 8.
There is firm evidence of enhanced oxidative stress in patients with alcoholic liver disease. Studies have shown increased plasma and tissue levels of markers of lipid peroxidation[13–16], and reduced hepatic and plasma antioxidant content[17–20].
In the liver, as in many other organs, NO• has many actions and cellular sources[4516–21]. Determination of the levels of the NO• radical itself is hampered by its radical nature and very short half-life (in the range of seconds). Because NO• activates soluble guanylate cyclase to produce cyclic guanosine 3’,5’ monophosphate (cGMP) and stable nitric oxide metabolites, we measured the levels of its metabolites, NO3- and NO2-, in serum, and the levels of cGMP in plasma. The intracellular concentrations of ROS are tightly regulated by multiple defence mechanisms involving ROS-scavenging enzymes and anti-oxidant molecules, which include glutathione and GSH dependent enzymes. We also measured the levels of glutathione in its thiol-reduced (GSHr) and glutathione disulfide (GSSG) forms to better understand the defence mechanisms involving GSH operating in alcoholic cirrhotic patients[22–24].
The data of this study indicate that serum concentrations of the NO• metabolites NO3- and NO2-, and those of plasma cGMP, an intracellular second messenger[25] of nitric oxide, in patients with alcoholic cirrhosis, were higher than those in healthy controls. The NO• and cGMP levels were higher in patients with decompensated liver cirrhosis (Child-Pugh B and C) than in those with compensated liver cirrhosis (Child-Pugh A) (P < 0.001). Our results also show a decrease in GSHt levels in alcoholic cirrhotic patients compared with healthy controls.
Associations were found between the levels of the biomarkers NO• and cGMP, as well as between the levels of each biomarker and MELD scores (P < 0.01). Significant negative correlations were observed between NO• levels and GSHr/GSSG ratios, and between MELD scores and GSHr/GSSG ratios, in the 26 alcoholic cirrhotic patients belonging to all three Child-Pugh classes (P < 0.01). The increased concentrations of GSSG in plasma provide a sensitive index of whole-body oxidative stress[26]. A deficiency of hepatic GSH and increased toxic free radical species may contribute to the progression of liver disease[1718].
One of the more common free radicals produced in response to the ingestion of ethanol is oxygen in a deformed toxic state. These radicals, known as reactive oxygen species, include oxygen radicals and substances closely related to oxygen radical reactions. They can play a role in the development of alcoholic hepatitis by altering the redox state, damaging cell constituents in the liver and causing severe injury[27].
NO• can interact with ROS to form other reactive nitrogen species (RNS). These reactive nitrogen species secondarily promote important reactions such as nitrosation (production of nitrosamines), oxidation (mediating lipid peroxidation, DNA strand breaks and hydroxylation) or nitration (production of nitrotyrosines and nitroguanosines), leading to impaired cellular functions and enhanced inflammatory reactions[28]. On the other hand, ROS stimulates stellate cell activation and fibrogenesis[202227]. Thus, oxidative stress seems to contribute to the pathogenesis of alcoholic liver injury and the progression of alcohol-induced liver disease to alcoholic cirrhosis[2223].
Patients with advanced liver disease tend to develop a hyperdynamic circulation, which complicates cirrhosis. There is vast experimental evidence for enhanced NO• overproduction and associated cGMP formation in cases of portal hypertension. Moreover, several clinical studies have evaluated NO• synthesis and serum levels in various cirrhotic conditions[29–32]. Our study, including only alcoholic patients of different Child classes, strengthens previous investigations and adds further information with respect to the second messenger cGMP and its relationship with the redox state of GSH.
NO• or nitrite/nitrate measurements can be affected by creatinine levels, as demonstrated recently in acute decompensated cirrhotic patients[32]. In our clinical population, patients with Child C cirrhosis had elevated creatinine values compared to those with Child A cirrhosis, and this could also influence the results. A positive correlation was found between creatinine levels and NO• and cGMP mediators in all three Child-Pugh classes (P < 0.01, P < 0.05), but no correlation between these mediators and creatinine was found in either decompensated or compensated cirrhotic patients. However, we found an inverse relationship between GSHr/GSSG ratios and creatinine levels, only in decompensated cirrhotic patients (P < 0.01). The elevated mediator levels could also be caused by portal hypertension and hyperdynamic circulation where NO• is elevated and, therefore, have no relation to intrahepatic oxidative stress. Recent studies by Lluch et al[29] suggest that the serum concentration of asymmetric dimethylarginine (ADMA), an endogenous inhibitor of nitric oxide synthase is elevated in patients with alcoholic cirrhosis. This finding may offer an alternative compensatory mechanism to counteract the excessive visceral vasodilatation caused by excess production of NO• in patient with advanced liver disease.
In summary, our study shows that patients with decompensated alcoholic cirrhosis have higher levels of NO• and cGMP than compensated patients, and that there is a positive correlation between the clinical score of the disease (Child-Pugh classes and MELD scores) and the abnormalities observed. Our findings suggest that NO• and cGMP may contribute to progressive liver disease in these patients and influence the hemodynamic abnormalities. Our findings emphasize the need for further investigations correlating the serum levels of NO•, cGMP or GSH seen in decompensated cirrhotic patients with their clinical outcomes (for example, survival, variceal bleeding, renal failure and septic complications) to develop prognostic parameters and delineate new therapeutic strategies.
Alcohol accounts for 40%-50% of all deaths due to cirrhosis and remains the most common cause of liver-related mortality. Important pathophysiologic events that mediate alcohol-induced liver injury include increased oxidative stress, hepatocyte apoptosis and necrosis and deposition of collagen, with ensuing fibrosis.
The correlation of mediators of oxidative stress with the severity of disease in patients with alcoholic liver injury has been studied intensively in recent years, mainly in patients with alcoholic hepatitis. We investigated patients with alcoholic cirrhosis and measured the levels of mediators of oxidative stress (namely, NO• and cGMP), antioxidant defences [thiol-reduced glutathione (GSHr) and glutathione disulfide (GSSG)] and correlated these levels with clinical liver disease severity.
In contrast to previous studies, we measured the levels of not only NO•, but also cGMP (an intracellular second messenger of NO•) and correlated these with mediators of antioxidant defence. We found that the levels of nitric oxide metabolites and cGMP were high in alcoholic cirrhotic patients, particularly in those that were decompensated. There was a positive correlation between the clinical score of the disease (Child-Pugh classes and MELD scores) and the oxidative stress abnormalities observed.
Our findings suggest that NO• and cGMP may contribute to progressive liver disease in these patients. Further investigations correlating the serum levels of NO•, cGMP or GSHr seen in decompensated cirrhotic patients with their clinical outcomes (for example, survival, variceal bleeding, renal failure and septic complications) are needed to develop better prognostic parameters and delineate new therapeutic strategies.
The authors measured nitric oxide metabolites in the serum and cGMP, GSH, and GSSG in the plasma with alcoholic cirrhosis patients. They found that nitric oxide metabolites and cGMP levels were high in alcoholic cirrhosis patients, particularly in decompensated alcoholic cirrhosis. Moreover, they found a significant negative correlation between GSH/GSSG ratio and MELD score in all cirrhotic patients.
| 1. | Parola M, Robino G. Oxidative stress-related molecules and liver fibrosis. J Hepatol. 2001;35:297-306. [Cited in This Article: ] |
| 2. | Martin PY, Gines P, Schrier RW. Nitric oxide as a mediator of hemodynamic abnormalities and sodium and water retention in cirrhosis. N Engl J Med. 1998;339:533-541. [Cited in This Article: ] |
| 3. | Palmer RM, Ashton DS, Moncada S. Vascular endothelial cells synthesize nitric oxide from L-arginine. Nature. 1988;333:664-666. [Cited in This Article: ] |
| 4. | Clemens MG. Nitric oxide in liver injury. Hepatology. 1999;30:1-5. [Cited in This Article: ] |
| 5. | Moncada S, Higgs A. The L-arginine-nitric oxide pathway. N Engl J Med. 1993;329:2002-2012. [Cited in This Article: ] |
| 6. | Garcia-Estan J, Ortiz MC, Lee SS. Nitric oxide and renal and cardiac dysfunction in cirrhosis. Clin Sci (Lond). 2002;102:213-222. [Cited in This Article: ] |
| 7. | Eiserich JP, Hristova M, Cross CE, Jones AD, Freeman BA, Halliwell B, van der Vliet A. Formation of nitric oxide-derived inflammatory oxidants by myeloperoxidase in neutrophils. Nature. 1998;391:393-397. [Cited in This Article: ] |
| 8. | Ma TT, Ischiropoulos H, Brass CA. Endotoxin-stimulated nitric oxide production increases injury and reduces rat liver chemiluminescence during reperfusion. Gastroenterology. 1995;108:463-469. [Cited in This Article: ] |
| 9. | Vodovotz Y, Kim PK, Bagci EZ, Ermentrout GB, Chow CC, Bahar I, Billiar TR. Inflammatory modulation of hepatocyte apoptosis by nitric oxide: in vivo, in vitro, and in silico studies. Curr Mol Med. 2004;4:753-762. [Cited in This Article: ] |
| 10. | Moshage H. Nitric oxide determinations: much ado about NO.-thing? Clin Chem. 1997;43:553-556. [Cited in This Article: ] |
| 11. | Loguercio C, Taranto D, Vitale LM, Beneduce F, Del Vecchio Blanco C. Effect of liver cirrhosis and age on the glutathione concentration in the plasma, erythrocytes, and gastric mucosa of man. Free Radic Biol Med. 1996;20:483-488. [Cited in This Article: ] |
| 12. | Huo TI, Lin HC, Wu JC, Lee FY, Hou MC, Lee PC, Chang FY, Lee SD. Proposal of a modified Child-Turcotte-Pugh scoring system and comparison with the model for end-stage liver disease for outcome prediction in patients with cirrhosis. Liver Transpl. 2006;12:65-71. [Cited in This Article: ] |
| 13. | Ljubuncic P, Tanne Z, Bomzon A. Evidence of a systemic phenomenon for oxidative stress in cholestatic liver disease. Gut. 2000;47:710-716. [Cited in This Article: ] |
| 14. | Paradis V, Kollinger M, Fabre M, Holstege A, Poynard T, Bedossa P. In situ detection of lipid peroxidation by-products in chronic liver diseases. Hepatology. 1997;26:135-142. [Cited in This Article: ] |
| 15. | Serejo F, Emerit I, Filipe PM, Fernandes AC, Costa MA, Freitas JP, de Moura MC. Oxidative stress in chronic hepatitis C: the effect of interferon therapy and correlation with pathological features. Can J Gastroenterol. 2003;17:644-650. [Cited in This Article: ] |
| 16. | Gutteridge JM. Lipid peroxidation and antioxidants as biomarkers of tissue damage. Clin Chem. 1995;41:1819-1828. [Cited in This Article: ] |
| 17. | Loguercio C, Federico A. Oxidative stress in viral and alcoholic hepatitis. Free Radic Biol Med. 2003;34:1-10. [Cited in This Article: ] |
| 18. | Yadav D, Hertan HI, Schweitzer P, Norkus EP, Pitchumoni CS. Serum and liver micronutrient antioxidants and serum oxidative stress in patients with chronic hepatitis C. Am J Gastroenterol. 2002;97:2634-2639. [Cited in This Article: ] |
| 19. | Minana JB, Gomez-Cambronero L, Lloret A, Pallardo FV, Del Olmo J, Escudero A, Rodrigo JM, Pellin A, Vina JR, Vina J and Sastre J. Mitochondrial oxidative stress CD 95 ligand: A dual mechanism for hepatocyte apoptosis in chronic alcoholism. Hepatology. 2002;35:1205-1214. [Cited in This Article: ] |
| 20. | Sen CK, Packer L. Antioxidant and redox regulation of gene transcription. FASEB J. 1996;10:709-720. [Cited in This Article: ] |
| 21. | Zanaro NL, Romero MC, Duek F, Imventarza O, Lendoire J, Sassetti B. Nitric oxide in liver transplantation. Clin Chem Lab Med. 2001;39:932-936. [Cited in This Article: ] |
| 22. | Wu D, Cederbaum AI. Alcohol, oxidative stress, and free radical damage. Alcohol Res Health. 2003;27:277-284. [Cited in This Article: ] |
| 23. | Lu SC, Kuhlenkamp J, Garcia-Ruiz C, Kaplowitz N. Hormone-mediated down-regulation of hepatic glutathione synthesis in the rat. J Clin Invest. 1991;88:260-269. [Cited in This Article: ] |
| 24. | Hoensch H, Morgenstern I, Petereit G, Siepmann M, Peters WH, Roelofs HM, Kirch W. Influence of clinical factors, diet, and drugs on the human upper gastrointestinal glutathione system. Gut. 2002;50:235-240. [Cited in This Article: ] |
| 25. | Montoliu C, Kosenko E, Calvete JJ, Nies AT, Del Olmo JA, Serra MA, Rodrigo JM, Felipo V. Increased protein kinase A regulatory subunit content and cGMP binding in erythrocyte membranes in liver cirrhosis. J Hepatol. 2004;40:766-773. [Cited in This Article: ] |
| 26. | Jain SK, Pemberton PW, Smith A, McMahon RF, Burrows PC, Aboutwerat A, Warnes TW. Oxidative stress in chronic hepatitis C: not just a feature of late stage disease. J Hepatol. 2002;36:805-811. [Cited in This Article: ] |
| 27. | Friedman SL. Molecular regulation of hepatic fibrosis, an integrated cellular response to tissue injury. J Biol Chem. 2000;275:2247-2250. [Cited in This Article: ] |
| 28. | Wiest R, Groszmann RJ. The paradox of nitric oxide in cirrhosis and portal hypertension: too much, not enough. Hepatology. 2002;35:478-491. [Cited in This Article: ] |
| 29. | Lluch P, Torondel B, Medina P, Segarra G, Del Olmo JA, Serra MA, Rodrigo JM. Plasma concentrations of nitric oxide and asymmetric dimethylarginine in human alcoholic cirrhosis. J Hepatol. 2004;41:55-59. [Cited in This Article: ] |
| 30. | Sogni P, Moreau R, Gadano A, Lebrec D. The role of nitric oxide in the hyperdynamic circulatory syndrome associated with portal hypertension. J Hepatol. 1995;23:218-224. [Cited in This Article: ] |
| 31. | Iwakiri Y, Groszmann RJ. Vascular endothelial dysfunction in cirrhosis. J Hepatol. 2007;46:927-934. [Cited in This Article: ] |
| 32. | Elsing C, Harenberg S, Stremmel W, Herrmann T. Serum levels of soluble Fas, nitric oxide and cytokines in acute decompensated cirrhotic patients. World J Gastroenterol. 2007;13:421-425. [Cited in This Article: ] |


