Copyright
©2006 Baishideng Publishing Group Co.
World J Gastroenterol. Feb 21, 2006; 12(7): 1078-1085
Published online Feb 21, 2006. doi: 10.3748/wjg.v12.i7.1078
Published online Feb 21, 2006. doi: 10.3748/wjg.v12.i7.1078
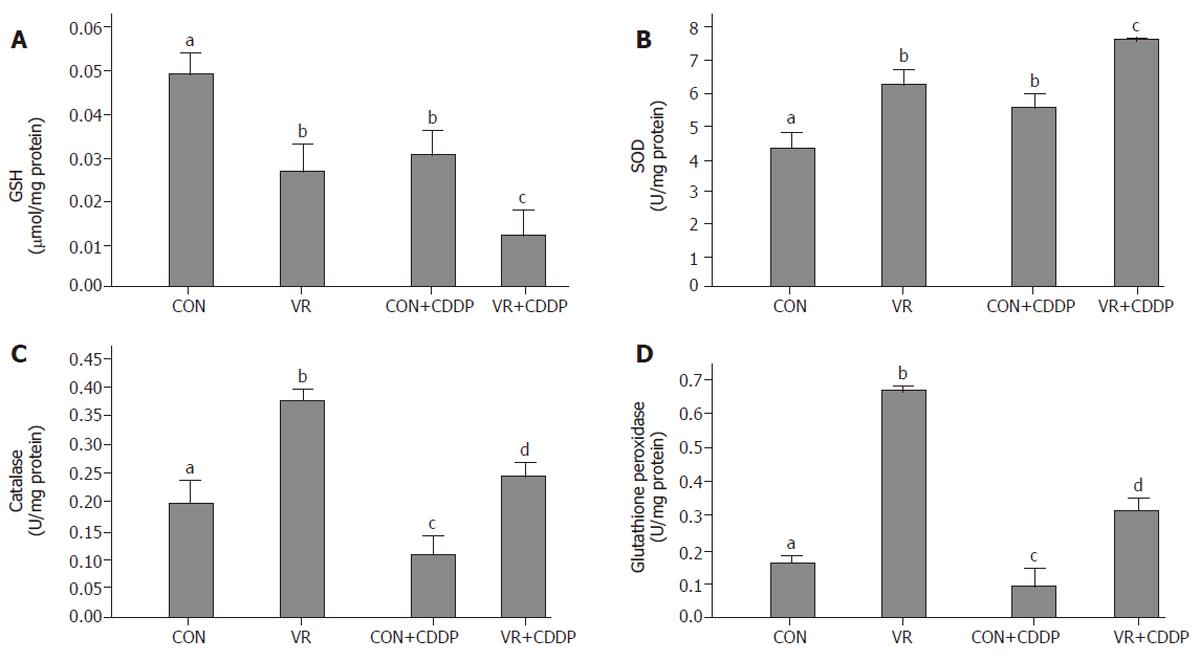
Figure 5 Intestinal glutathione levels and antioxidant enzyme activities in control and vitamin restricted rats treated with saline or cisplatin.
Glutathione (GSH) levels are shown in panel A, whereas activities of SOD, catalase and glutathione peroxidase (GPX) are shown in panels B to D, respectively.
- Citation: Vijayalakshmi B, Sesikeran B, Udaykumar P, Kalyanasundaram S, Raghunath M. Chronic low vitamin intake potentiates cisplatin-induced intestinal epithelial cell apoptosis in WNIN rats. World J Gastroenterol 2006; 12(7): 1078-1085
- URL: https://www.wjgnet.com/1007-9327/full/v12/i7/1078.htm
- DOI: https://dx.doi.org/10.3748/wjg.v12.i7.1078


