Copyright
©2005 Baishideng Publishing Group Inc.
World J Gastroenterol. Nov 21, 2005; 11(43): 6775-6779
Published online Nov 21, 2005. doi: 10.3748/wjg.v11.i43.6775
Published online Nov 21, 2005. doi: 10.3748/wjg.v11.i43.6775
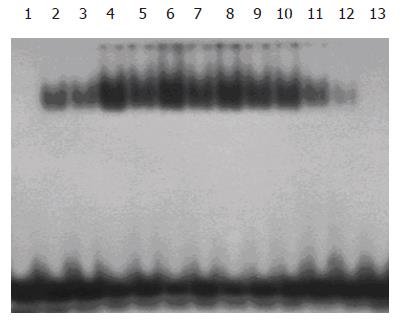
Figure 1 Changes of NF-κB binding activity in rat liver at different time points after 70% PBL by EMSA.
Lane 1: control group; lanes 2, 4, 6, 8, 10, 12: 0.5, 1, 2, 3, 7, 14 d ligated liver lobes in PBL group; lanes 3, 5, 7, 9, 11, 13: 0.5, 1, 2, 3, 7, 14 d nonligated liver lobes in PBL group.
- Citation: Yang WJ, Zhang QY, Yu ZP, Song QT, Liang HP, Xu X, Zhu GB, Jiang FZ, Shi HQ. Effects of nuclear factor-kappaB on rat hepatocyte regeneration and apoptosis after 70% portal branch ligation. World J Gastroenterol 2005; 11(43): 6775-6779
- URL: https://www.wjgnet.com/1007-9327/full/v11/i43/6775.htm
- DOI: https://dx.doi.org/10.3748/wjg.v11.i43.6775


