Copyright
©2005 Baishideng Publishing Group Inc.
World J Gastroenterol. Nov 14, 2005; 11(42): 6624-6630
Published online Nov 14, 2005. doi: 10.3748/wjg.v11.i42.6624
Published online Nov 14, 2005. doi: 10.3748/wjg.v11.i42.6624
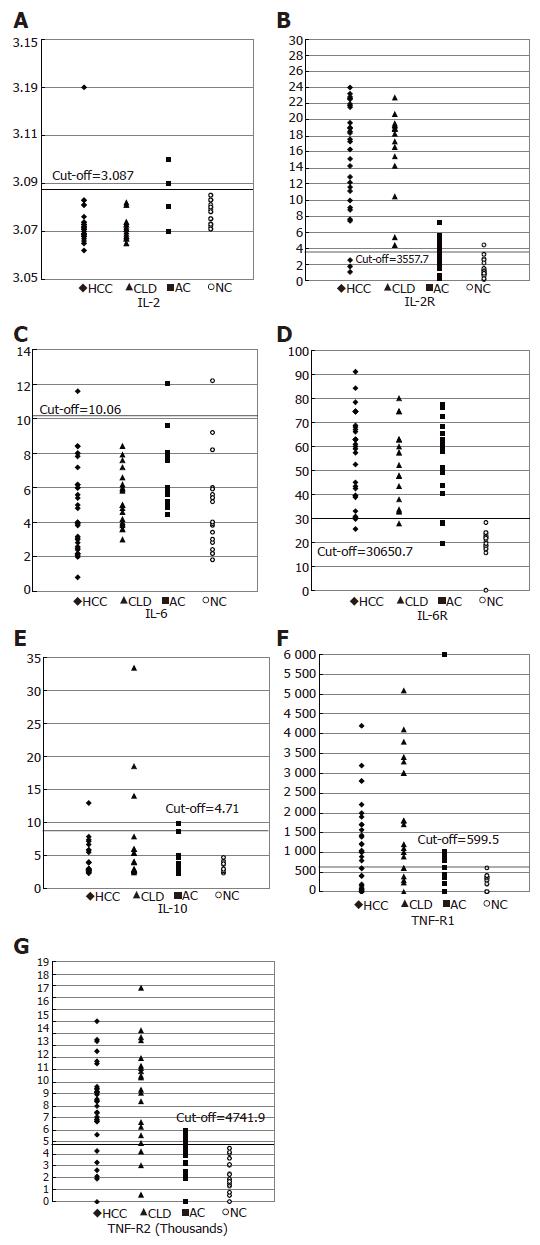
Figure 1 Scatter diagram represents the distribution value of (A) IL-2, (B) IL-2R (C) IL-6, (D) IL-6R, (E) IL-10, (F) TNF-R1, (G) TNF-R2 in HCC, CLD, ASC and normal controls around the cut-off value.
- Citation: Zekri ARN, Ashour MSED, Hassan A, El-Din HMA, El-Shehaby AM, Abu-Shady MA. Cytokine profile in Egyptian hepatitis C virus genotype-4 in relation to liver disease progression. World J Gastroenterol 2005; 11(42): 6624-6630
- URL: https://www.wjgnet.com/1007-9327/full/v11/i42/6624.htm
- DOI: https://dx.doi.org/10.3748/wjg.v11.i42.6624


