Copyright
©The Author(s) 2016.
World J Gastroenterol. Oct 7, 2016; 22(37): 8334-8348
Published online Oct 7, 2016. doi: 10.3748/wjg.v22.i37.8334
Published online Oct 7, 2016. doi: 10.3748/wjg.v22.i37.8334
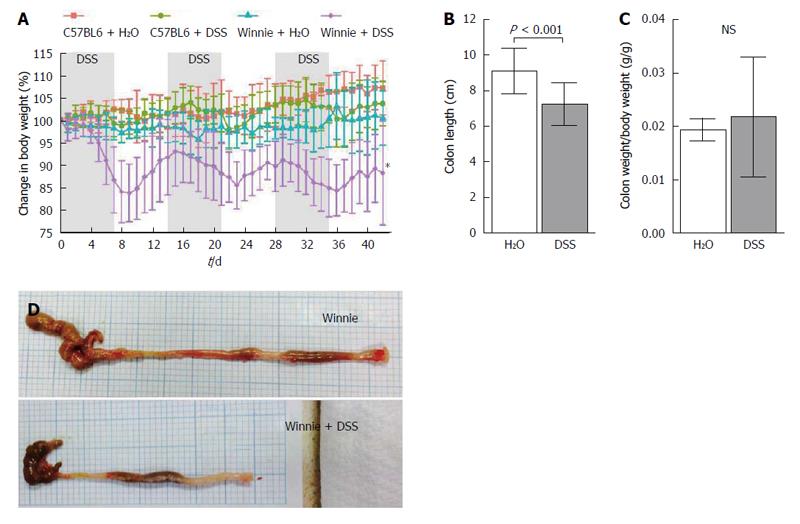
Figure 1 Clinical features of dextran sulphate sodium-induced colitis in Winnie.
A: Daily change in body weight of wild-type; B: Winnie mice during the three cycle experimental dextran sulphate sodium (DSS) regimen. Body weight was recorded each day and recorded as percentage change from the starting body weight prior to commencement of the experiment (day 0). Each point represents the mean percentage change in body weight relative to the initial body weight (n = 4). Error bars depict standard deviation (SD) from the mean. Asterisk signifies difference (P < 0.05) between control Winnie mice and Winnie mice exposed to DSS; C: Mean colon length at termination. Error bars depict SD from the mean; D: Gross appearance of the Winnie colon at termination. Representative images of Winnie colon after receiving three cycles of water only (top) and the colon of Winnie receiving three cycles of DSS (bottom).
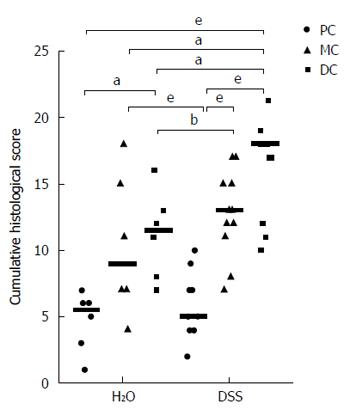
Figure 2 Three cycles of dextran sulphate sodium exacerbated Winnie colitis.
Comparison of summed inflammation scores between control Winnie mice and Winnie mice receiving dextran sulphate sodium (DSS). PC, proximal colon, MC, middle colon, DC, distal colon. Bars represent medians of each group, individual animals represented as single points. aP < 0.05, bP < 0.01, eP < 0.001.
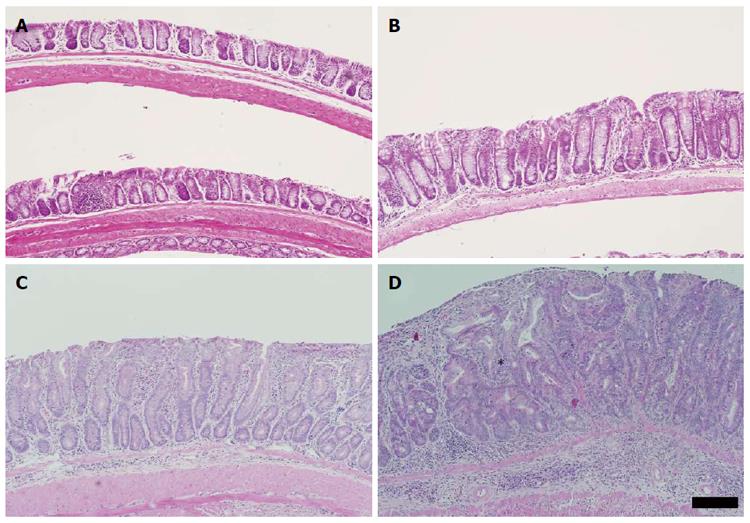
Figure 3 Distal colonic mucosal alterations induced by three cycles of dextran sulphate sodium.
A: Representative image of the distal colon obtained from one of four untreated C57BL/6 mouse; B: C57BL/6 distal colon exposed to dextran sulphate sodium (DSS). Image representative of six eighteen week-old C57BL/6 mice exposed to three cycles of 1% DSS; C: Distal colon of Winnie mouse without exposure to DSS. Crypts are hyperplastic and the mucosa displays a marked leukocytic infiltration. Image representative of six untreated Winnie mice examined; D: Distal colon of Winnie mouse displaying colonic hyperplasia and mild focal dysplasia following three cycles of 1% DSS. Mucosa displays features of an active chronic inflammation, with prominent submucosal leukocytic infiltrate. Extensive crypt hyperplasia is visible with a focus of atypical glandular architecture (asterisk). Note the loss of surface epithelium. Numerous mitotic figures are evident. Image representative of the hyperplasia and dysplastic foci total of eleven Winnie mice exposed to three cycles of 1% DSS. All sections stained with HE, scale bar is equivalent to 100 μm.
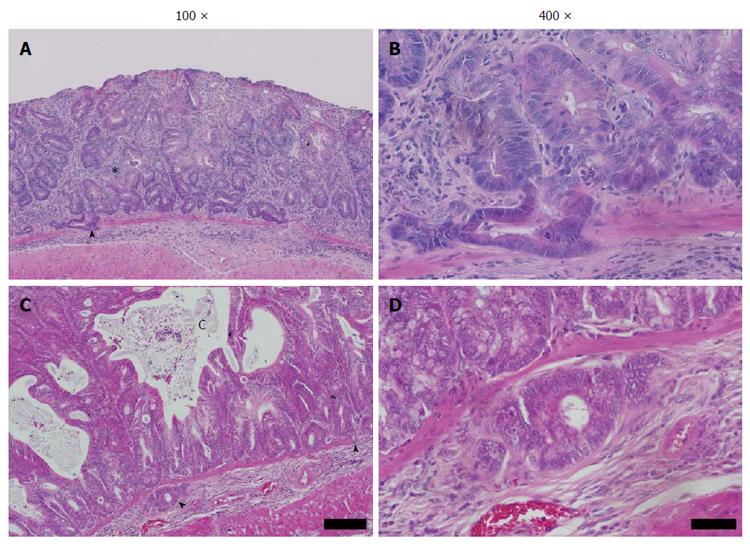
Figure 4 High-grade dysplasia and submucosal penetration in Winnie.
A: Winnie distal colonic mucosa after DSS exposure. Distorted and atypical hyperplastic glands (asterisk), with focal infiltration into underlying submucosa through an otherwise intact muscularis mucosae (arrowhead); B: Higher magnification of A. Atypical mucosal and submucosal glands display relatively bland cytology; nuclear polarity mostly intact, though nucleus: cytoplasm ratio is increased. Mitotic figures are common beyond the crypt base. Region of crypt epithelium displaying loss of nuclear polarity (arrowheads). Note the stroma surrounding submucosal glands; C: Regenerative distal colonic mucosa featuring abnormal hyperplastic crypts. Multiple large mucus-containing cysts have formed, apparently formed by confluent dilated crypts lined with hyperplastic goblet cells. Crypts displayed back-to-back arrangement associated with high-grade dysplasia; D: Higher magnification of E. Focal penetration of the submucosa by atypical mucosal crypt. Multifocal penetration of the muscularis mucosae by the overlying abnormal crypts (arrowheads). Stained with HE, scale bar represents 100 μm in A and C, 20 μm in B and D.
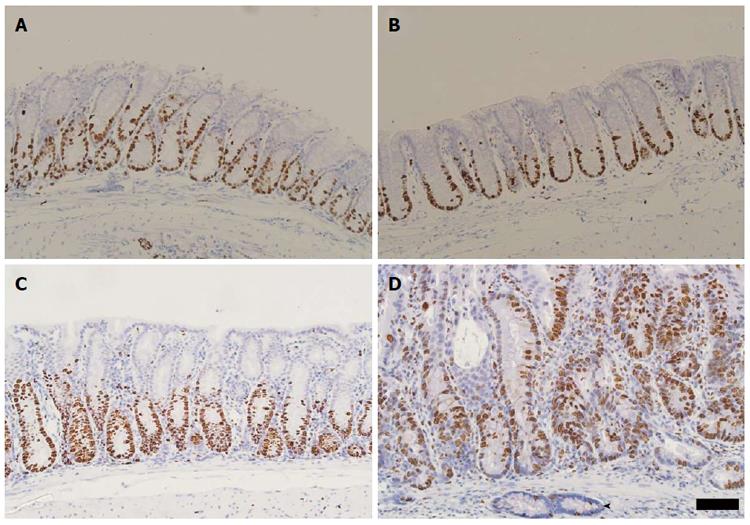
Figure 5 Immunohistochemical detection of Ki67 in Winnie distal colonic mucosa.
A: Immunostaining of Ki67 in the distal colon of untreated C57BL6 mice. Image representative of Ki67 localisation in the distal colon of the four C57BL6 mice examined; B: Distal colonic Ki67 localisation representative of six C57BL6 mice exposed to three cycles of 1% dextran sulphate sodium (DSS); C: Distal colon of Winnie mouse without exposure to three cycles of DSS. Ki67-labelling in the epithelium is visible apically approximately half the crypt length; D: Ki67 immunolabelling of the Winnie distal colon exposed to three cycles of DSS. Crypt base proliferative zone extends approximately two-thirds of the crypt length. Submucosal gland (arrowhead) displays few positive nuclei. Scale bar represents a distance of 50 μm.
Figure 6 Localisation of β-catenin in Winnie distal colonic mucosa.
A: Representative image of Winnie distal colon of the six animals without DSS exposure immunostained for β-catenin. B-catenin in the colonic epithelium is primarily associated with the epithelial cell membrane; B: Immunostained dysplastic distal colonic mucosa from a Winnie mouse exposed to three cycles of DSS (representative of n = 11). B-catenin localised to the cell membrane of epithelial cells without any nuclear accumulation. Scale bar is equivalent to 100 μm.
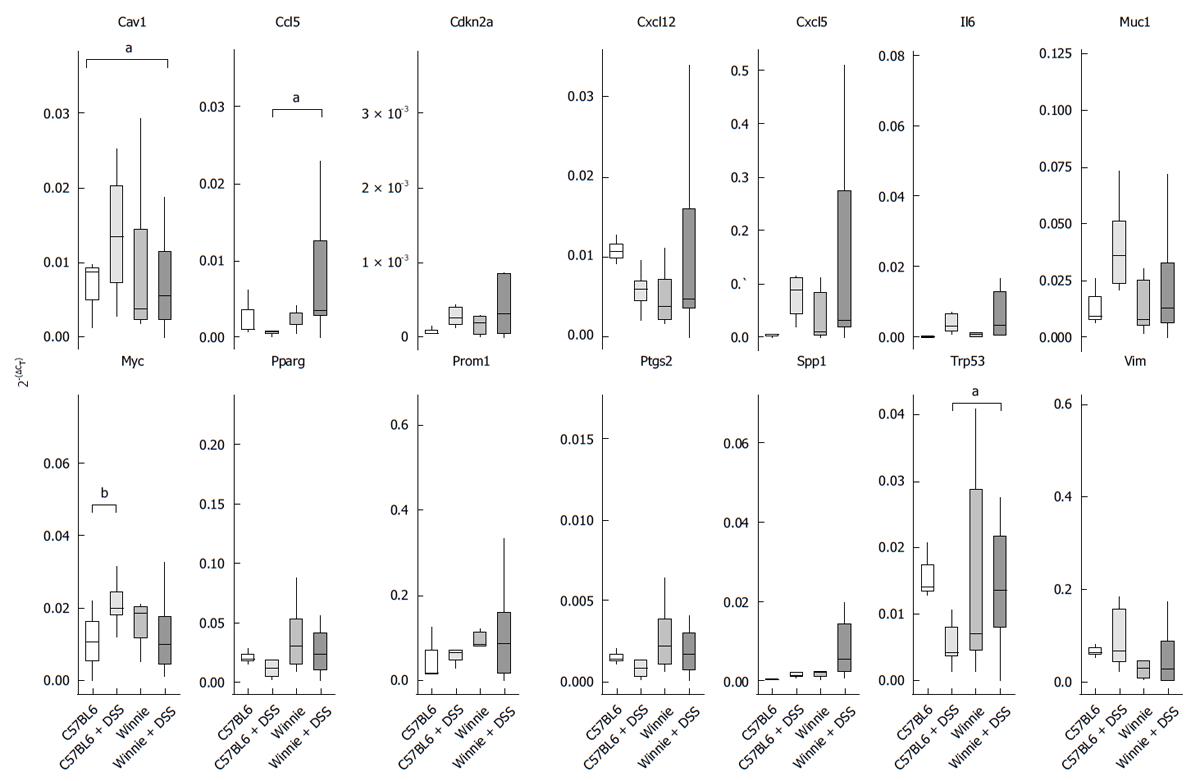
Figure 7 Relative transcript abundance of genes regulating inflammation and cell proliferation.
Transcript abundance measured from 25 ng of template based on the linearised 2-ΔCT method, where each gene of interest was normalised to the relative abundance of a reference gene (Gapdh). Box plot depicts interquartile range (IQR) either side of the median for each combination of treatment and genotype (3-11 mice per group). Whiskers represent 1.5 IQR approximately equivalent to 5%-95% confidence intervals. aP < 0.05, bP < 0.01.
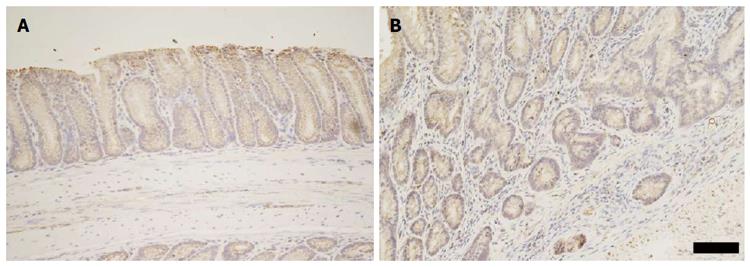
Figure 8 Immunohistochemical detection of Cxcl5 in Winnie distal colonic mucosa.
A: Representative distal colon from Winnie without DSS exposure (n = 6). Cxcl5 labelling displayed a diffuse cytoplasmic pattern in the colonic epithelium; B: Representative distal mucosa of Winnie exposed to DSS (n = 11). Dysplastic glands displaying focal reduction in epithelial Cxcl5. Weak Cxcl5 immunolabelling is present within the cytoplasm of the epithelial cells lining dysplastic glands. Note that submucosal epithelium penetrating the muscularis mucosae retains Cxcl5 expression. Scale bar represents 50 μm.
- Citation: Randall-Demllo S, Fernando R, Brain T, Sohal SS, Cook AL, Guven N, Kunde D, Spring K, Eri R. Characterisation of colonic dysplasia-like epithelial atypia in murine colitis. World J Gastroenterol 2016; 22(37): 8334-8348
- URL: https://www.wjgnet.com/1007-9327/full/v22/i37/8334.htm
- DOI: https://dx.doi.org/10.3748/wjg.v22.i37.8334


