Published online Nov 15, 2018. doi: 10.4251/wjgo.v10.i11.439
Peer-review started: July 20, 2018
First decision: August 31, 2018
Revised: September 6, 2018
Accepted: October 17, 2018
Article in press: October 17, 2018
Published online: November 15, 2018
To investigate the possibility of diagnosing gastric cancer from an unstained pathological tissue using Raman spectroscopy, and to compare the findings to those obtained with conventional histopathology.
We produced two consecutive tissue specimens from areas with and without cancer lesions in the surgically resected stomach of a patient with gastric cancer. One of the two tissue specimens was stained with hematoxylin and eosin and used as a reference for laser irradiation positioning by the spectroscopic method. The other specimen was left unstained and used for Raman spectroscopy analysis.
A significant Raman scattering spectrum could be obtained at all measurement points. Raman scattering spectrum intensities of 725 cm-1 and 782 cm-1, are associated with the nucleotides adenine and cytosine, respectively. The Raman scattering spectrum intensity ratios of 782 cm-1/620 cm-1, 782 cm-1/756 cm-1, 782 cm-1/1250 cm-1, and 782 cm-1/1263 cm-1 in the gastric adenocarcinoma tissue were significantly higher than those in the normal stomach tissue.
The results of this preliminary experiment suggest the feasibility of our spectroscopic method as a diagnostic tool for gastric cancer using unstained pathological specimens.
Core tip: We investigated the possibility of diagnosing gastric cancer from an unstained pathological tissue using Raman spectroscopy, and the findings were compared to those obtained with conventional histopathology. We analyzed unstained gastric pathological specimens by Raman spectroscopy. The Raman scattering spectrum intensity ratios of 782 cm-1/620 cm-1, 782 cm-1/756 cm-1, 782 cm-1/1250 cm-1, and 782 cm-1/1263 cm-1 in the gastric adenocarcinoma tissue were significantly higher than those in the normal stomach tissue. The results of this preliminary experiment suggest the feasibility of our spectroscopic method as a diagnostic tool for gastric cancer using unstained pathological specimens.
- Citation: Ikeda H, Ito H, Hikita M, Yamaguchi N, Uragami N, Yokoyama N, Hirota Y, Kushima M, Ajioka Y, Inoue H. Raman spectroscopy for the diagnosis of unlabeled and unstained histopathological tissue specimens. World J Gastrointest Oncol 2018; 10(11): 439-448
- URL: https://www.wjgnet.com/1948-5204/full/v10/i11/439.htm
- DOI: https://dx.doi.org/10.4251/wjgo.v10.i11.439
Histopathologic diagnosis represents the ultimate diagnostic method for many cancers[1]. The histopathological diagnosis method involves microscopic observation of a formalin-fixed specimen for a morphological diagnosis. Although chemical tissue staining is generally performed, such as hematoxylin and eosin staining, immunohistochemical (IHC) tissue staining using an antigen-antibody reaction may also be performed on pathological tissue specimens to obtain more detailed information on the cells and tissues[2,3]. Despite its advantage for improving diagnostic accuracy in carcinomas[4,5], IHC is a longer process than general chemical tissue staining, and the antigen-antibody reaction requires precise conditions; thus, preparation of IHC specimens demands a relatively high level of professional skill.
Raman scattering spectroscopy is a non-destructive method for determining the types and components that make up a given substance[6], allowing for qualitative evaluation without requiring direct contact with the substance through irradiation and subsequent evaluation of the reflected scattered light (e.g., laser). The Raman scattering intensity is correlated with the target substance[7], and this method can be used to evaluate substances in any state, i.e., gas[8], liquid[9], or solid state[10]. Besides its simplicity and minimally invasive non-destructive nature, Raman spectroscopy enables the evaluation of substances without staining or labeling for an antigen-antibody reaction, and thus has potential for use in unstained pathological tissue specimens. Moreover, since Raman scattering spectroscopy is also suitable for evaluation of living bodies[11], evaluation of both the collected tissue as well as the living body might be possible with this approach[12].
To date, Raman scattering spectroscopy has been used to analyze biological tissue specimens such as the brain[13], thyroid gland[14], mammary gland[15], liver[16], and kidney[17]; however, its clinical significance has not yet been clarified.
As a preliminary examination of the potential of Raman scattering spectroscopy for diagnosis, we evaluated this method in an unstained stomach tissue specimen, and compared the findings with those of conventional histopathology.
The Institutional Review Board of Showa University approved the study. This study was registered with the University Hospital Medical Information Network in Japan, number UMIN000017045.
We used the surgically resected stomach of a patient who provided informed consent for its use for this study after explaining the study protocol. The patient was a 61-year-old man diagnosed with early-stage gastric cancer of the mid-stomach, who underwent laparoscopic distal gastrectomy at Showa University Koto Toyosu Hospital in April 2015. The resected stomach was processed using general histopathological specimen preparation procedures. First, it was immersed in 20% neutral buffered formalin solution for 3 d for fixation, and subsequently dehydrated by immersion in 70% ethanol, 90% ethanol, and then 100% ethanol for 100 min each. Finally, the specimen was immersed in xylene three times for 2 h each, and embedded in paraffin.
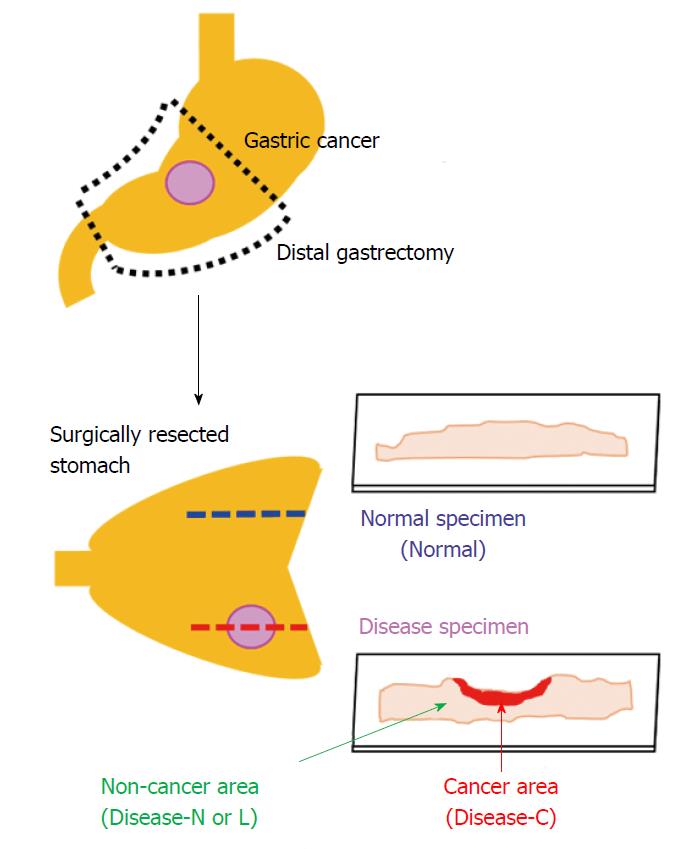
We produced two consecutive tissue specimens from areas with and without stomach cancer lesions. Each tissue specimen was sliced to a thickness of 3 μm with a microtome and attached to a 1-mm-thick and low-autofluorescence slide (SUPER FROST, Matsunami Glass Ind., Ltd., Osaka, Japan). A thin cover glass (NEO microscope cover glass, Matsunami Glass Ind., Ltd., Tokyo, Japan) was placed onto the tissue specimen.
The sections were deparaffinized by sequential immersion in xylene, ethanol, and water. One of the two tissue specimens was stained with hematoxylin and eosin and used as a reference for laser irradiation positioning by the spectroscopic method. Another tissue specimen was left unstained and used for Raman spectroscopy analysis. We acquired the Raman spectrum of the cancer area (Disease-C), non-cancerous lymphocytes infiltration area (Disease-L), and non-cancerous normal area (Disease-N) in the stomach cancer specimen and normal stomach tissue specimen (Normal) (Figure 1).
Two specialized pathologists at Showa University Koto Toyosu Hospital performed the histopathological diagnosis, which was determined to be type 0–IIc, 30 mm × 17 mm, well-differentiated adenocarcinoma, pT1bs (sm2), ly0, v0, pN0, Stage IA.
We used an inVia Raman microscope (Renishaw, Gloucestershire, United Kingdom), with a 100 × objective lens and a laser light source with a wavelength of 532 nm. We irradiated the tissue specimen with minimum power, and then gradually raised the laser output until it became visible within the field of view. The minimum visible laser output was 0.0002 mW. We adjusted the focus so that the beam diameter was minimized, based on visual observation. Spectra were digitized using standard spectroscopy software (WiRE 4; Renishaw, Gloucestershire, United Kingdom).
The conditions for laser output and laser irradiation time were established on a marginal part of an unstained tissue specimen that included both gastric cancer lesion and non-lesion areas. To prevent tissue degeneration, we reduced the laser power as much as possible while maintaining detection of the Raman spectrum. Optimal measurement conditions were determined to be a laser output of 1.7 mW and an irradiation time of 10 s.
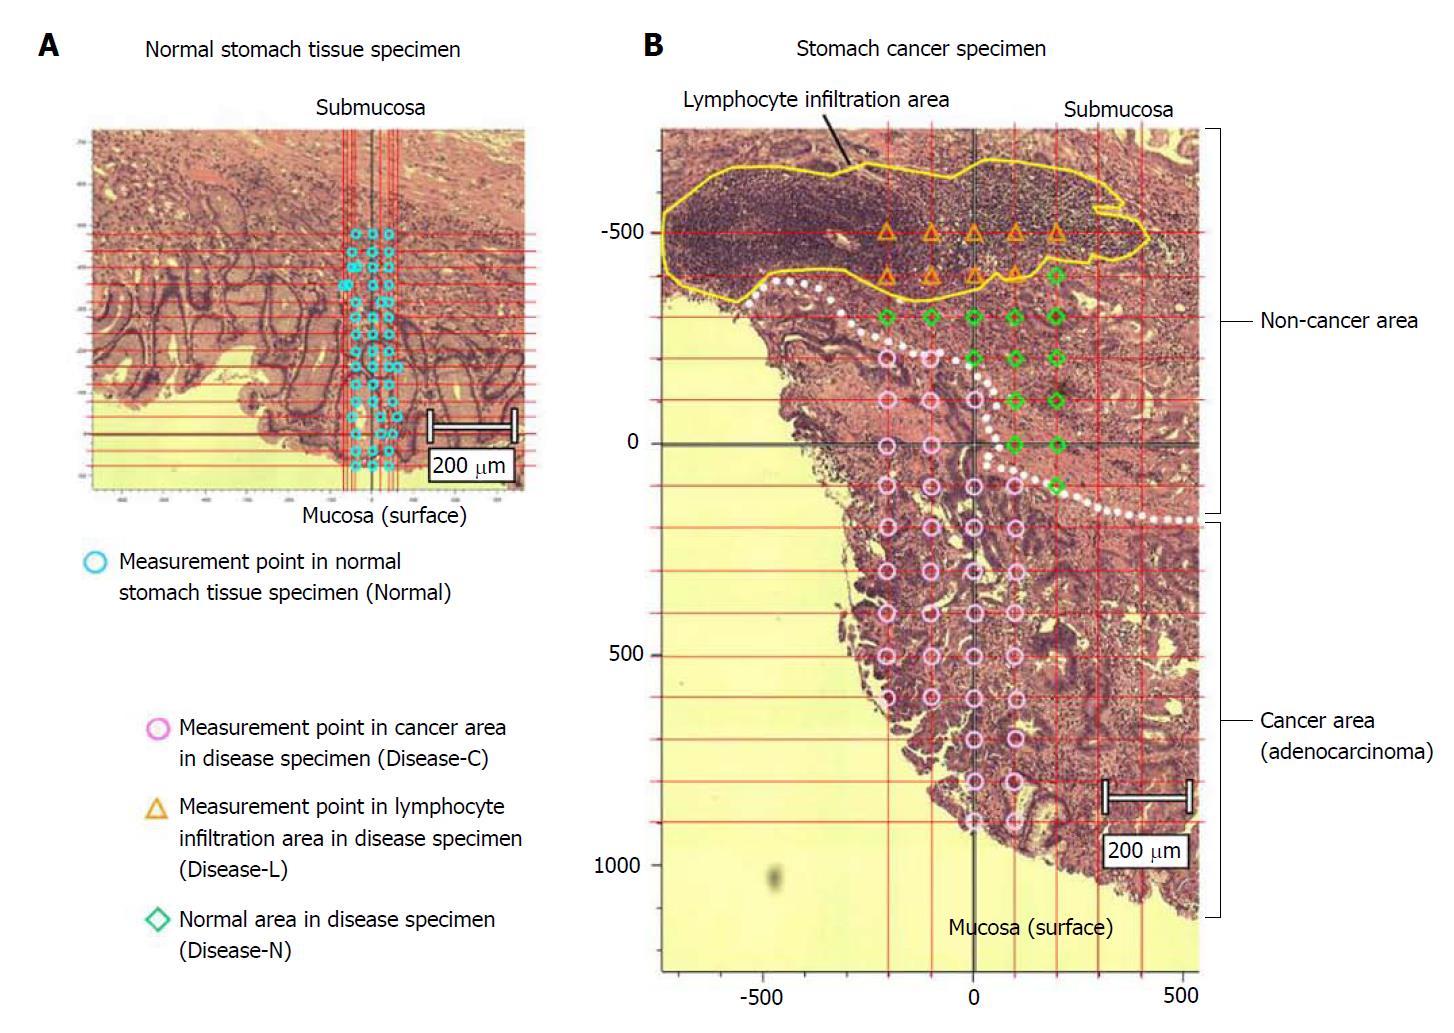
We measured the tissue specimens at regular intervals from the mucous membrane to the submucosal layer. In principle, intersection points of straight lines every 100 μm of both the length and width were used as the representative spectrum. We measured 121 points around one intersection point as far as a 10-μm square, and defined the mean value as a spectrum of the intersection point. From each obtained spectrum, we removed a spectrum only for glass by data processing. Furthermore, we similarly removed the spectrum of autologous fluorescence by the fifth-polynomial expression[18].
When a cell nucleus was observed, the field of view was fine-tuned to focus the laser on it. We measured 60 and 48 points in the stomach cancer and normal tissue specimens, respectively. The 60 measured points in the stomach cancer specimen included 37 measured points in Disease-C and 23 measured points in the non-cancer area, nine of which were Disease-L and 14 were Disease-N (Figure 2).
We measured the Raman scattering spectrum intensities at 620 cm-1 (C-C twisting mode of phenylalanine)[19], 725 cm-1 (adenine)[19], 756 cm-1 (symmetric breathing of tryptophan)[19], 782 cm-1 (cytosine)[20], 1002 cm-1 (phenylalanine)[20], 1250 cm-1 (amide IIIβ-sheet)[21], and 1263 cm-1 (amide IIIα-Helix)[21], corresponding to the Raman scattering wavenumber of the organism constitution organic substance. We then calculated the ratio of the Raman scattering spectrum intensities of 725 cm-1 and 782 cm-1, associated with the nucleotides, to those of the others.
Statistical analyses were performed using JMP Pro 13.2.1 software (SAS Institute Inc., Cary, NC, United States). We statistically compared spectral intensity ratios among the four groups (Disease-C, Disease-N, Disease-L, and Normal) using a non-parametric Wilcoxon test. P-values less than 0.05 were considered statistically significant.
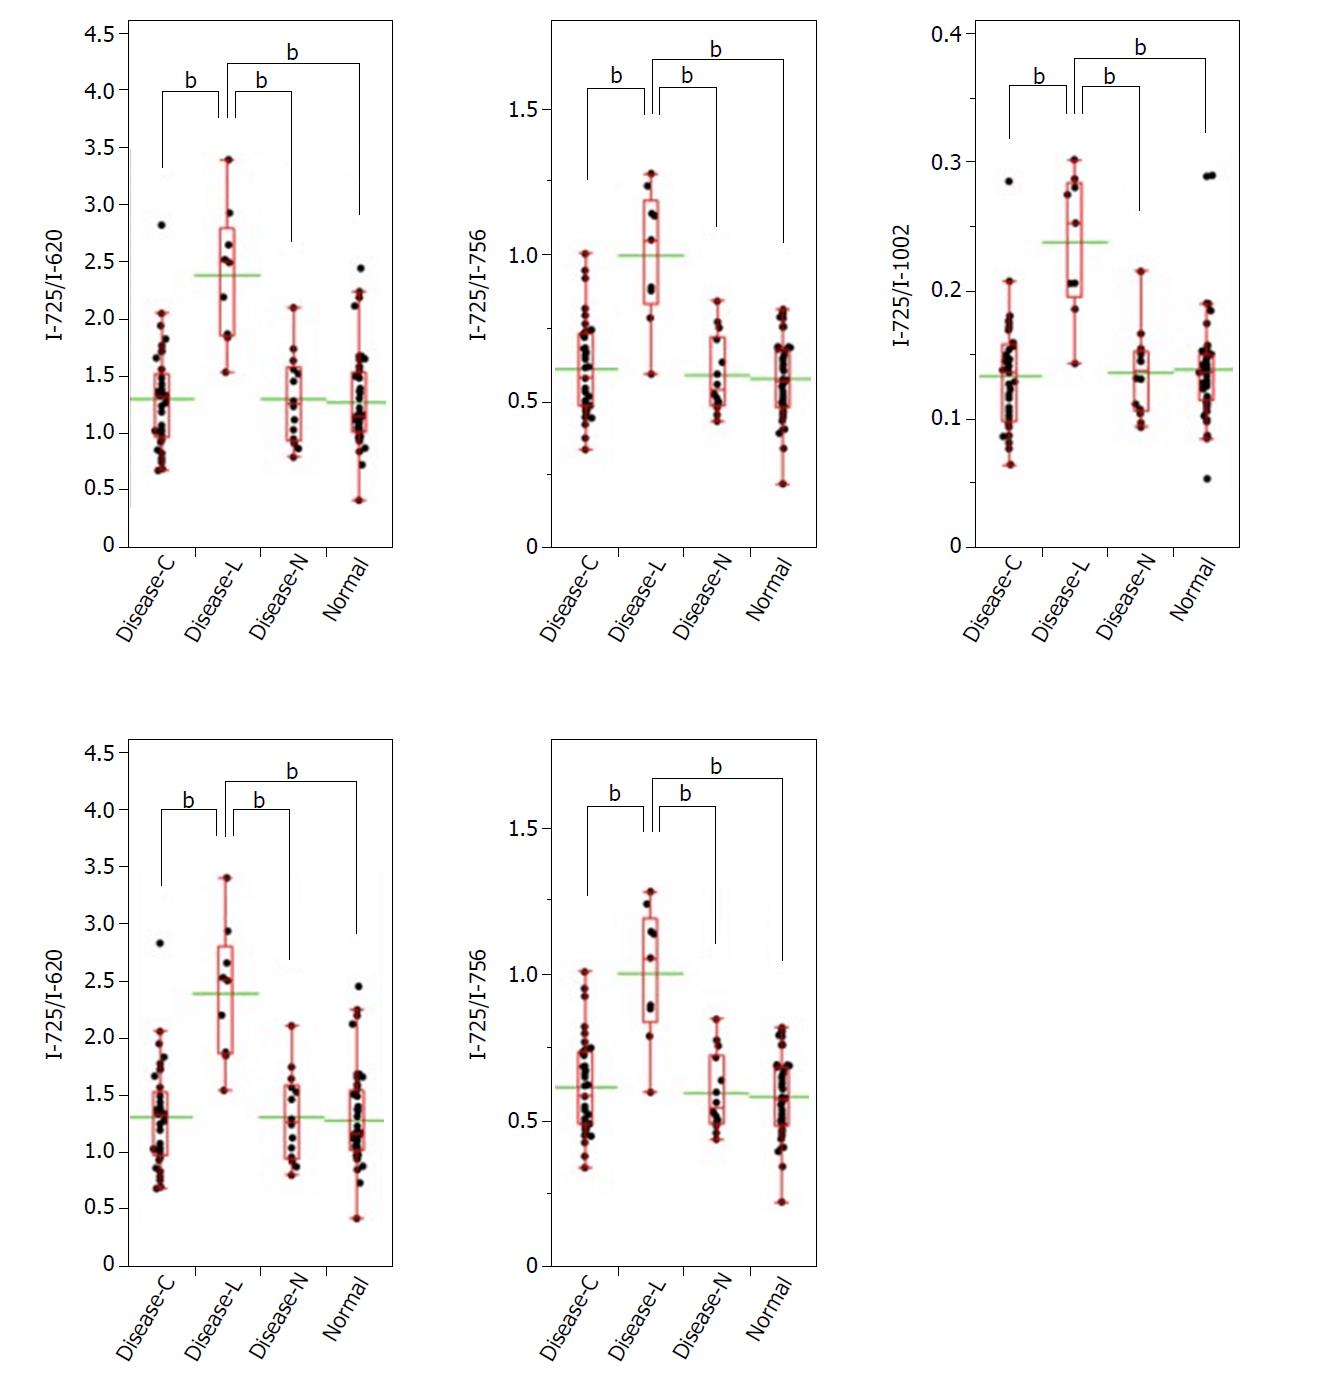
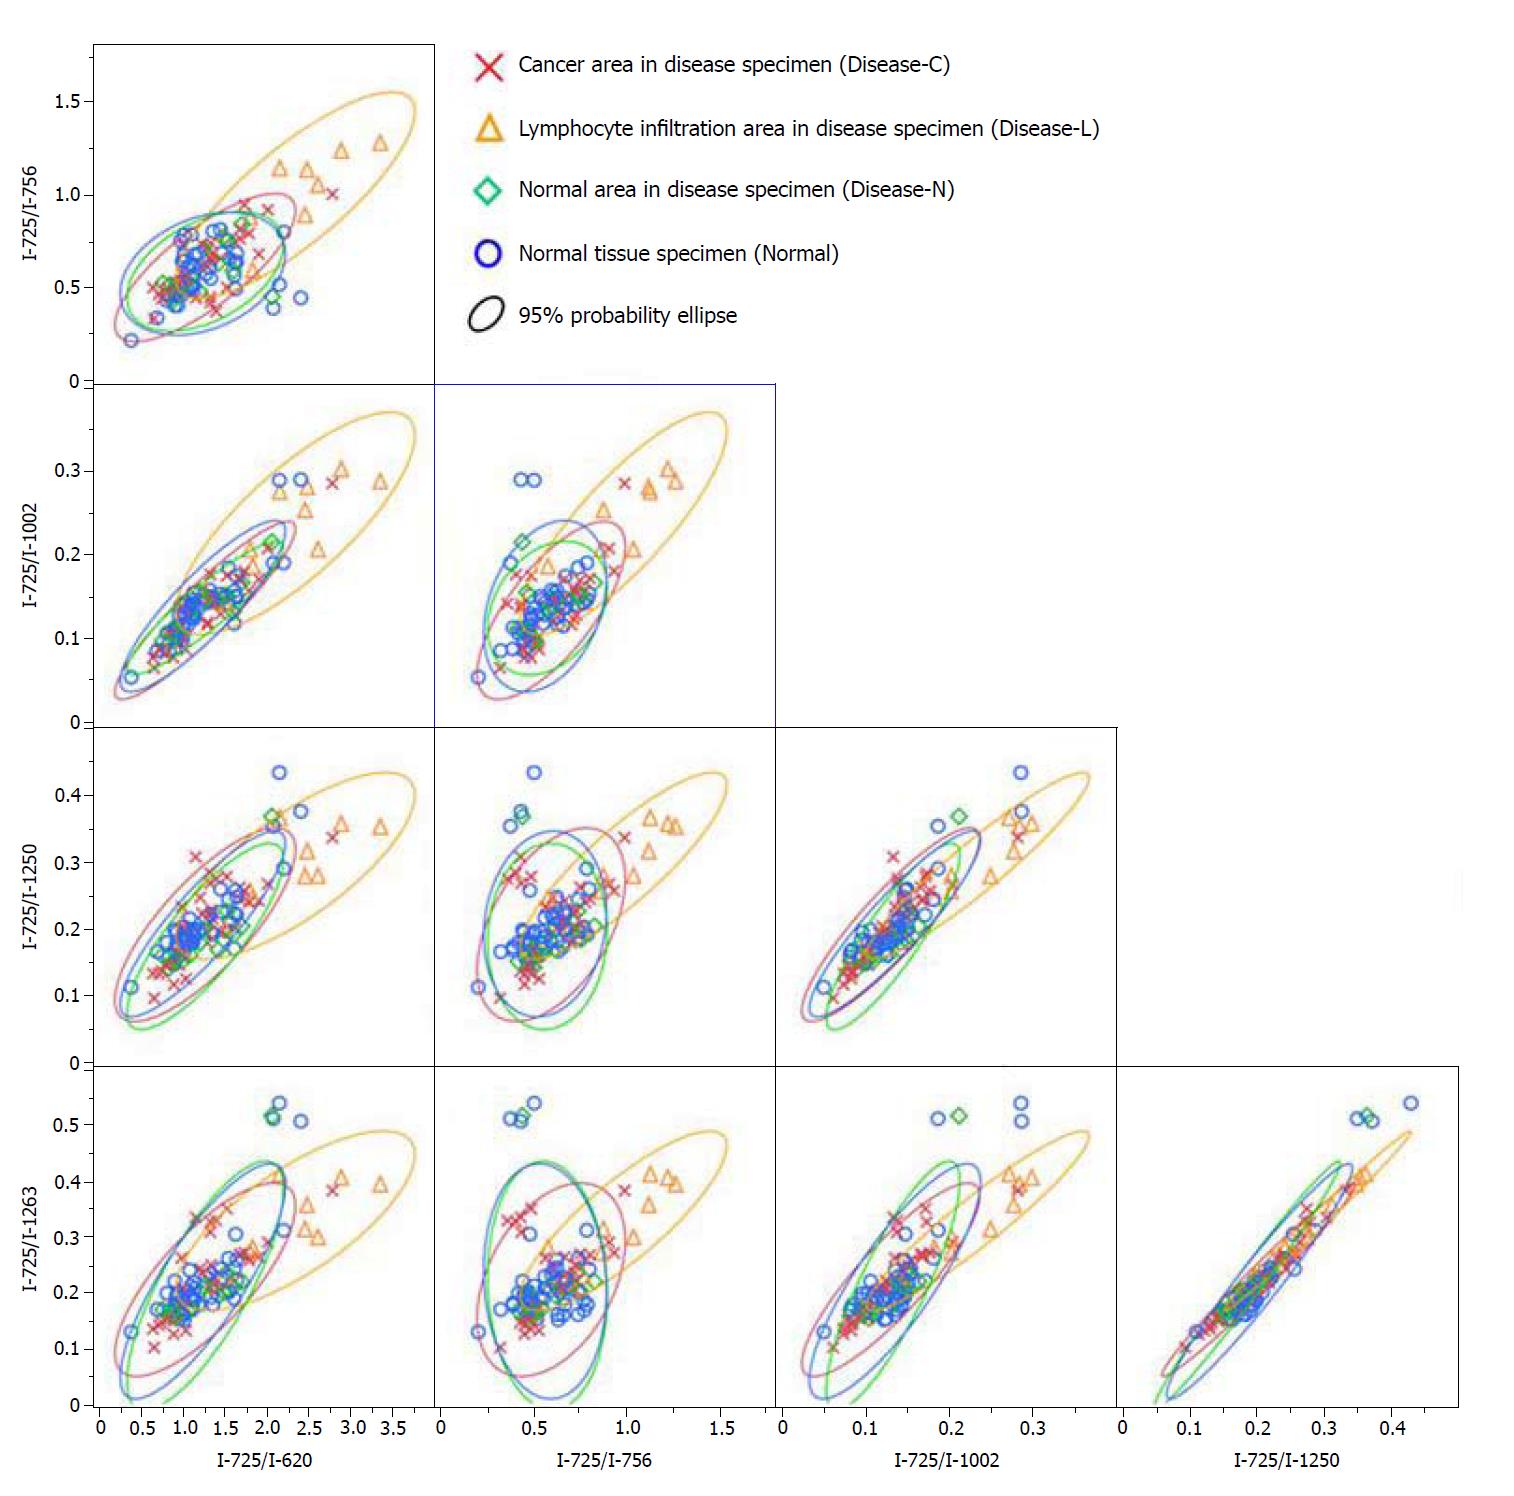
A significant Raman scattering spectrum could be obtained at all measurement points. Focusing on the intensity of the Raman scattering wavenumber 725 cm-1 derived from the nucleotide adenine, we found that all of the measured values for the ratios 725 cm-1/620 cm-1, 725 cm-1/756 cm-1, 725 cm-1/1002 cm-1, 725 cm-1/1250 cm-1, and 725 cm-1/1263 cm-1 in the Disease-L tissue were significantly higher than those in the Disease-C, Disease-N, and Normal specimens, with no significant difference among these latter three groups (Figure 3). In the biaxial distribution, the distribution areas of the measured values of the Disease-C, Disease-N, and Normal specimens widely overlapped. Only the distribution area of the measurement value of Disease-L extended toward the higher value direction (Figure 4).
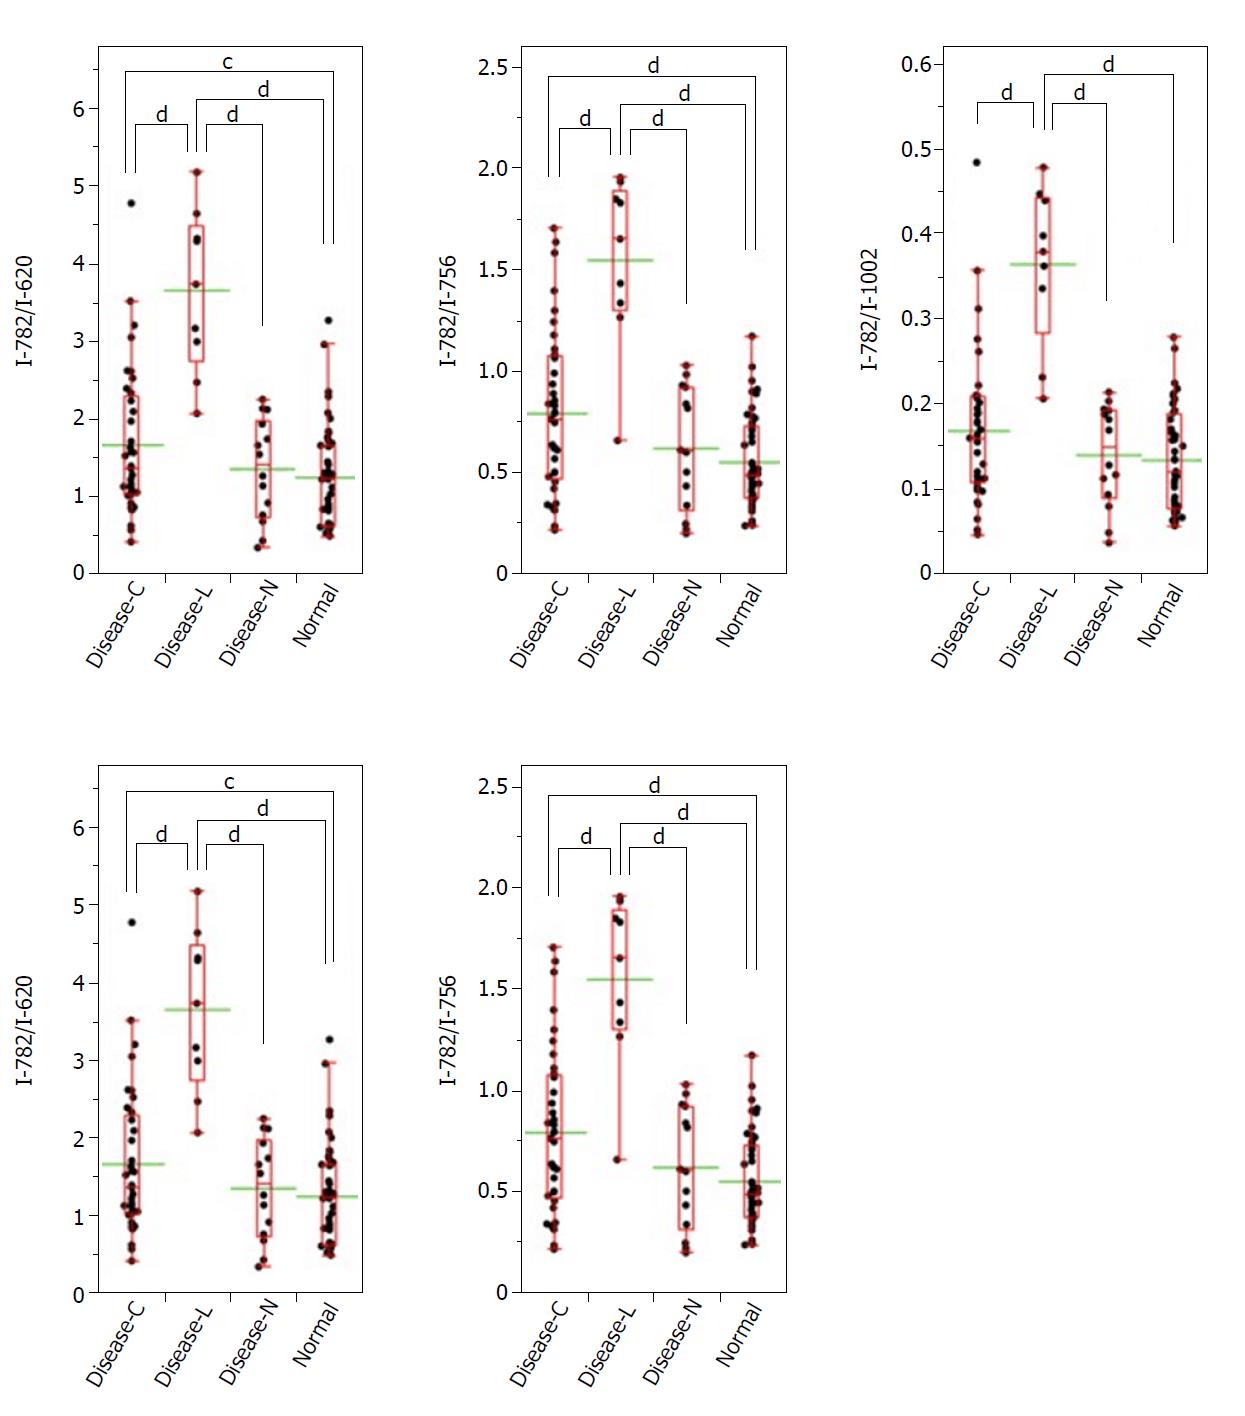
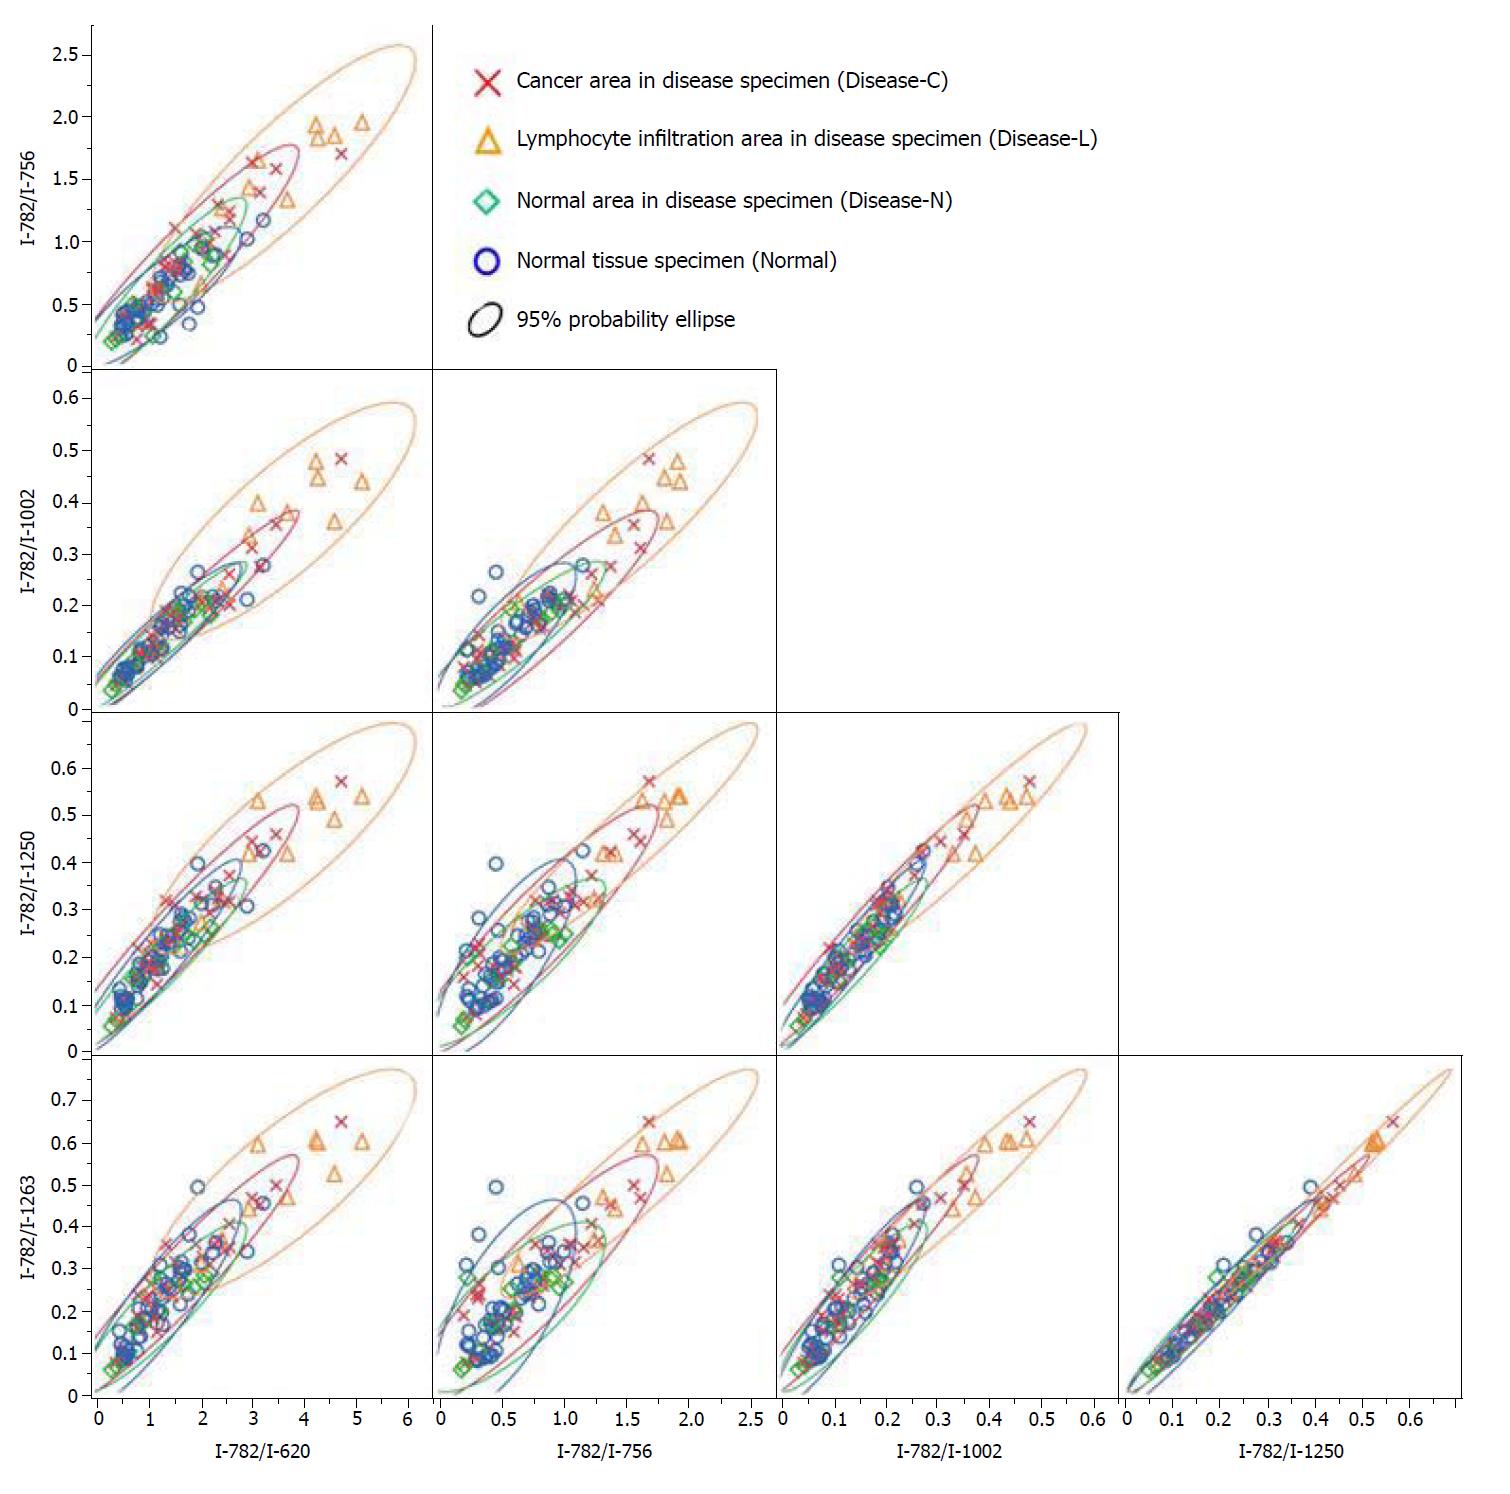
Similarly, focusing on the intensity of the Raman scattering wavenumber 782 cm-1 derived from the nucleotide cytosine, all of the measured values of 782 cm-1/620 cm-1, 782 cm-1/756 cm-1, 782 cm-1/1002 cm-1, 782 cm-1/1250 cm-1, and 782 cm-1/1263 cm-1 in the Disease-L specimen were significantly higher than those of the other three groups. Moreover, the measured values of the 782 cm-1/620 cm-1, 782 cm-1/756 cm-1, 782 cm-1/1250 cm-1, and 782 cm-1/1263 cm-1 ratios in the Disease-C specimen were significantly higher than those in the Normal specimen. There was no significant difference of the measured values between the Disease-C and Disease-N specimens, and between the Disease-N and Normal specimens (Figure 5). In the biaxial distribution, the distribution areas of measured values of Disease-N and Normal specimens widely overlapped. The distribution area of the measurement value of Disease-L extended toward the higher value direction, and the values for Disease-C were distributed in the middle of the range (Figure 6).
Gastrointestinal cancers such as esophageal cancer, stomach cancer, colon cancer, and rectal cancer are typically confirmed with an endoscope, and then tissues are collected for histopathological confirmation of the diagnosis, which requires histochemical or IHC staining. Although the procedure for general histochemical staining is relatively simple, the diagnostic capability is limited. By contrast, IHC can provide a more accurate histopathological diagnosis, but is relatively time-consuming and requires specialized skills.
Raman scattering spectroscopy shows potential as a non-destructive method for live tissue evaluation, including the brain[22] and lung[23]; however, its potential utility for clinical in vivo evaluation has not yet been determined. Furthermore, although a few small-scale studies have been conducted on gastrointestinal tissue spectroscopy analysis[24-26], standard spectroscopy evaluation methods for living organisms have not yet been established. Here, we demonstrated that Raman scattering spectroscopy could be used to qualitatively evaluate unstained pathological tissue specimens since the cancer lymphocyte infiltration area in the gastric cancer tissue specimen (Disease-N) showed the most characteristic measurement value, followed by the cancer portion in the stomach cancer tissue specimen (Disease-C).
Based on comparison of the ratio of the Raman scattering spectrum intensities of 725 cm-1 and 782 cm-1, associated with the nucleotides adenine and cytosine, respectively, to those of the others, our results suggested that cytosine is present in the Disease-C region at a relatively high concentration, and both adenine and cytosine exist in the Disease-L region at a relatively high concentration in the stomach tissue. In addition, both adenine and cytosine were presumed to be present at higher concentrations in the Disease-L specimen compared to the Disease-C specimen.
Adenine and cytosine are bases that make up DNA. In tumor cells, the nuclear DNA amount is often in aneuploidy; thus, the cytosine concentration is theoretically expected to be high in tumor cells[27]. By contrast, in lymphocytes, nuclear DNA is haploidal in many cases, and thus the amount of DNA in a given cell would not be expected to differ from that of a normal cell[27]. The clustered lymphocytes observed in the stomach cancer tissue specimens used in this study had a nucleus size equivalent to that of normal cells albeit a smaller cell size. Therefore, in the Disease-L region, it is likely that the focal point of the laser struck the cell nucleus, so that the Raman scattering intensities of 725 cm-1 and 782 cm-1, derived from adenine and cytosine, were more strongly measured. Lymphocyte infiltration in tissues suggests the presence of inflammation or an immune response. Given the significant relationship between malignancies and lymphocyte infiltration[28,29], confirmation of lymphocyte infiltration may help to detect any abnormalities, including malignant disease.
Given the preliminary nature of the study, there are some limitations that should be mentioned. First, histopathological samples are intended for general histopathological diagnosis, but without staining, and they were not optimized for spectroscopy. For evaluation by spectroscopy, we need to consider conditions such as the thickness of the specimen and the material of the plate to which the specimen is attached. Second, the sample size was small, and we only focused on the stomach without assessment of other organs. Third, the data were obtained using a limited wavelength laser, and the focus position of the laser could not be precisely controlled at a prescribed region of the cell. In particular, it has been suggested that lasers of longer wavelength such as 1064 nm are more suitable for analyzing samples with strong autofluorescence such as living tissue[30]. Therefore, other laser light sources should be tested in future studies, including long-wavelength lasers.
Therefore, for future experiments, we will optimize the analytical sample for spectroscopy by examining the tissue specimen, material, and thickness of the slide glass, and conduct measurements under more precise regulation. Moreover, we plan to expand the experiments for testing the effects of different wavelengths and in different organs.
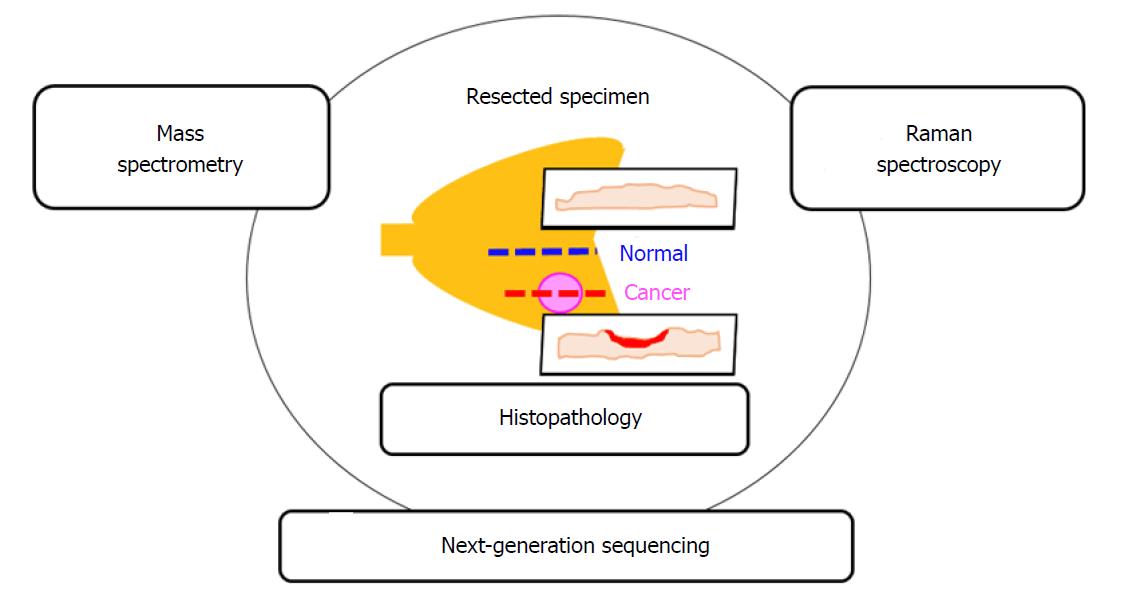
Finally, toward realizing the ultimate goal of more accurate cancer diagnosis, it will be important to compare the results obtained from Raman scattering spectroscopy with the histopathological diagnosis as the present gold-standard, as well as with molecular biological findings obtained by next-generation sequencing and mass spectrometry (Figure 7).
Currently, Raman spectroscopy is an ancillary technique for adding qualitative information to histopathological morphological diagnosis. Further verification of our results and optimization of the technology as described above should help toward application of Raman spectroscopy as a diagnostic pathology technology without requiring staining or labeling. These advantages will help to more quickly and accurately diagnose cancer, and to realize early treatment initiation, with ultimate improvement of the treatment outcome. Moreover, such technology would allow for making a definitive diagnosis in vivo without invasive procedures of tissue collection and time-consuming histopathological diagnosis. Therefore, the biopsy step can be omitted to diagnose cancer quickly and less invasively.
Histopathological evaluation is the gold-standard for cancer diagnosis. However, the diagnostic accuracy of histopathology staining is low, and the protocols for immunohistochemistry are complicated and time-consuming.
To achieve rapid, accurate and minimally invasive cancer diagnosis, a label-free and non-contact diagnostic technology is useful. Raman scattering spectroscopy has been used to analyze several types of biological tissue specimens; however, the clinical significance and diagnostic accuracy of this approach remain unclear. In addition, there are currently no standardized evaluation methods of gastrointestinal tissue spectroscopy analysis for living organisms.
We used the surgically resected stomach of a patient who underwent.
The resected stomach was processed using general histopathological specimen preparation procedures. We produced two consecutive tissue specimens from areas with and without stomach cancer lesions. Each tissue specimen was sliced to a thickness of 3 μm and attached to a low-autofluorescence slide. One of the two tissue specimens was stained with hematoxylin and eosin and used as a reference for laser irradiation positioning by the spectroscopic method. Another tissue specimen was left unstained and used for Raman spectroscopy analysis by a laser light source with a wavelength of 532 nm.
Raman scattering spectrum intensities of 725 cm-1 and 782 cm-1, are associated with the nucleotides adenine and cytosine, respectively. The Raman scattering spectrum intensity ratios of 782 cm-1/620 cm-1, 782 cm-1/756 cm-1, 782 cm-1/1250 cm-1, and 782 cm-1/1263 cm-1 in the gastric adenocarcinoma tissue were significantly higher than those in the normal stomach tissue. In addition, both adenine and cytosine were presumed to be present at higher concentrations in the non-cancerous lymphocytes infiltration area surrounding cancer compared to the cancer area in the gastric adenocarcinoma tissue specimen.
This preliminary experiment suggests the feasibility of our spectroscopic method as a diagnostic tool for gastric cancer using unstained pathological specimens. The Molecular biological differences among cells in the resected stomach tissue can be detected by Raman spectroscopy. Adenine and cytosine may be influential substances for histopathological diagnosis by Raman spectroscopy. By focusing on adenine and cytosine, we were able to distinguish qualitative differences in the stomach tissue by Raman spectroscopy. Both adenine and cytosine were presumed to be present at higher concentration in the gastric adenocarcinoma tissue were significantly higher than those in the normal stomach tissue. We measured the Raman scattering spectrum intensities at 620 cm-1 (C-C twisting mode of phenylalanine), 725 cm-1 (adenine), 756 cm-1 (symmetric breathing of tryptophan), 782 cm-1 (cytosine), 1002 cm-1 (phenylalanine), 1250 cm-1 (amide IIIβ-sheet), and 1263 cm-1 (amide IIIα-Helix), corresponding to the Raman scattering wavenumber of the organism constitution organic substance. We then calculated the ratio of the Raman scattering spectrum intensities of 725 cm-1 and 782 cm-1, associated with the nucleotides, to those of the others. We compared the ratio of the Raman scattering spectrum intensities of 725 cm-1 and 782 cm-1, associated with the nucleotides adenine and cytosine to qualitatively evaluate tissue. We found that Raman scattering spectrum intensities associated with the nucleotides adenine and cytosine were higher in adenocarcinoma than in normal tissue specimen of the stomach. In conclusion, we were able to distinguish qualitative differences in the stomach tissue by Raman spectroscopy.
The Molecular biological differences among cells in the resected stomach tissue can be detected by Raman spectroscopy. In the future, we should raise the accuracy of estimation by Raman spectroscopy and to complete it as a technology that can obtain both high-precision morphological information and qualitative information.
We are grateful to the clinical staff at Showa University Koto Toyosu Hospital.
Manuscript source: Invited manuscript
Specialty type: Oncology
Country of origin: Japan
Peer-review report classification
Grade A (Excellent): 0
Grade B (Very good): B
Grade C (Good): C
Grade D (Fair): 0
Grade E (Poor): 0
P- Reviewer: Jeong KY, Xu XY S- Editor: Ma RY L- Editor: A E- Editor: Tan WW
| 1. | O'Sullivan B, Brierley J, Byrd D, Bosman F, Kehoe S, Kossary C, Piñeros M, Van Eycken E, Weir HK, Gospodarowicz M. The TNM classification of malignant tumours-towards common understanding and reasonable expectations. Lancet Oncol. 2017;18:849-851. [PubMed] [DOI] [Cited in This Article: ] [Cited by in Crossref: 136] [Cited by in F6Publishing: 116] [Article Influence: 16.6] [Reference Citation Analysis (0)] |
| 2. | Compton CC, Fielding LP, Burgart LJ, Conley B, Cooper HS, Hamilton SR, Hammond ME, Henson DE, Hutter RV, Nagle RB. Prognostic factors in colorectal cancer. College of American Pathologists Consensus Statement 1999. Arch Pathol Lab Med. 2000;124:979-994. [PubMed] [DOI] [Cited in This Article: ] [Cited by in F6Publishing: 4] [Reference Citation Analysis (0)] |
| 3. | Winn B, Tavares R, Fanion J, Noble L, Gao J, Sabo E, Resnick MB. Differentiating the undifferentiated: immunohistochemical profile of medullary carcinoma of the colon with an emphasis on intestinal differentiation. Hum Pathol. 2009;40:398-404. [PubMed] [DOI] [Cited in This Article: ] [Cited by in Crossref: 59] [Cited by in F6Publishing: 57] [Article Influence: 3.6] [Reference Citation Analysis (0)] |
| 4. | McLean EC, Monaghan H, Salter DM, Wallace WA. Evaluation of adjunct immunohistochemistry on reporting patterns of non-small cell lung carcinoma diagnosed histologically in a regional pathology centre. J Clin Pathol. 2011;64:1136-1138. [PubMed] [DOI] [Cited in This Article: ] [Cited by in Crossref: 8] [Cited by in F6Publishing: 8] [Article Influence: 0.6] [Reference Citation Analysis (0)] |
| 5. | Taliano RJ, LeGolvan M, Resnick MB. Immunohistochemistry of colorectal carcinoma: current practice and evolving applications. Hum Pathol. 2013;44:151-163. [PubMed] [DOI] [Cited in This Article: ] [Cited by in Crossref: 20] [Cited by in F6Publishing: 10] [Article Influence: 0.8] [Reference Citation Analysis (0)] |
| 6. | Shimoyama M, Ninomiya T, Ozaki Y. Nondestructive discrimination of ivories and prediction of their specific gravity by Fourier-transform Raman spectroscopy and chemometrics. Analyst. 2003;128:950-953. [PubMed] [Cited in This Article: ] |
| 7. | He L, D Deen B, Pagel AH, Diez-Gonzalez F, Labuza TP. Concentration, detection and discrimination of Bacillus anthracis spores in orange juice using aptamer based surface enhanced Raman spectroscopy. Analyst. 2013;138:1657-1659. [PubMed] [DOI] [Cited in This Article: ] [Cited by in Crossref: 39] [Cited by in F6Publishing: 40] [Article Influence: 3.6] [Reference Citation Analysis (0)] |
| 8. | Balabin RM. The identification of the two missing conformers of gas-phase alanine: a jet-cooled Raman spectroscopy study. Phys Chem Chem Phys. 2010;12:5980-5982. [PubMed] [DOI] [Cited in This Article: ] [Cited by in Crossref: 47] [Cited by in F6Publishing: 47] [Article Influence: 3.4] [Reference Citation Analysis (0)] |
| 9. | Eliasson C, Macleod NA, Matousek P. Noninvasive detection of concealed liquid explosives using Raman spectroscopy. Anal Chem. 2007;79:8185-8189. [PubMed] [DOI] [Cited in This Article: ] [Cited by in Crossref: 118] [Cited by in F6Publishing: 118] [Article Influence: 6.9] [Reference Citation Analysis (0)] |
| 10. | Taylor LS, Langkilde FW. Evaluation of solid-state forms present in tablets by Raman spectroscopy. J Pharm Sci. 2000;89:1342-1353. [PubMed] [Cited in This Article: ] |
| 11. | Paidi SK, Siddhanta S, Strouse R, McGivney JB, Larkin C, Barman I. Rapid Identification of Biotherapeutics with Label-Free Raman Spectroscopy. Anal Chem. 2016;88:4361-4368. [PubMed] [DOI] [Cited in This Article: ] [Cited by in Crossref: 26] [Cited by in F6Publishing: 26] [Article Influence: 3.3] [Reference Citation Analysis (0)] |
| 12. | Matousek P, Draper ER, Goodship AE, Clark IP, Ronayne KL, Parker AW. Noninvasive Raman spectroscopy of human tissue in vivo. Appl Spectrosc. 2006;60:758-763. [PubMed] [DOI] [Cited in This Article: ] [Cited by in Crossref: 167] [Cited by in F6Publishing: 133] [Article Influence: 7.4] [Reference Citation Analysis (0)] |
| 13. | Zhang J, Fan Y, He M, Ma X, Song Y, Liu M, Xu J. Accuracy of Raman spectroscopy in differentiating brain tumor from normal brain tissue. Oncotarget. 2017;8:36824-36831. [PubMed] [DOI] [Cited in This Article: ] [Cited by in Crossref: 31] [Cited by in F6Publishing: 35] [Article Influence: 5.8] [Reference Citation Analysis (0)] |
| 14. | Rau JV, Graziani V, Fosca M, Taffon C, Rocchia M, Crucitti P, Pozzilli P, Onetti Muda A, Caricato M, Crescenzi A. RAMAN spectroscopy imaging improves the diagnosis of papillary thyroid carcinoma. Sci Rep. 2016;6:35117. [PubMed] [DOI] [Cited in This Article: ] [Cited by in Crossref: 26] [Cited by in F6Publishing: 25] [Article Influence: 3.1] [Reference Citation Analysis (0)] |
| 15. | Kong K, Zaabar F, Rakha E, Ellis I, Koloydenko A, Notingher I. Towards intra-operative diagnosis of tumours during breast conserving surgery by selective-sampling Raman micro-spectroscopy. Phys Med Biol. 2014;59:6141-6152. [PubMed] [DOI] [Cited in This Article: ] [Cited by in Crossref: 72] [Cited by in F6Publishing: 72] [Article Influence: 7.2] [Reference Citation Analysis (0)] |
| 16. | Pence IJ, Patil CA, Lieber CA, Mahadevan-Jansen A. Discrimination of liver malignancies with 1064 nm dispersive Raman spectroscopy. Biomed Opt Express. 2015;6:2724-2737. [PubMed] [DOI] [Cited in This Article: ] [Cited by in Crossref: 33] [Cited by in F6Publishing: 20] [Article Influence: 2.2] [Reference Citation Analysis (0)] |
| 17. | Liu Y, Du Z, Zhang J, Jiang H. Renal mass biopsy using Raman spectroscopy identifies malignant and benign renal tumors: potential for pre-operative diagnosis. Oncotarget. 2017;8:36012-36019. [PubMed] [DOI] [Cited in This Article: ] [Cited by in Crossref: 11] [Cited by in F6Publishing: 8] [Article Influence: 1.3] [Reference Citation Analysis (0)] |
| 18. | Lieber CA, Mahadevan-Jansen A. Automated method for subtraction of fluorescence from biological Raman spectra. Appl Spectrosc. 2003;57:1363-1367. [PubMed] [DOI] [Cited in This Article: ] [Cited by in Crossref: 730] [Cited by in F6Publishing: 545] [Article Influence: 26.0] [Reference Citation Analysis (0)] |
| 19. | Gelder JD, Gussem KD, Vandenabeele P, Moens L. Reference database of Raman spectra of biological molecules. J Raman Spectrosc. 2007;38:1133–1147. [DOI] [Cited in This Article: ] |
| 20. | Yao H, Tao Z, Ai M, Peng L, Wang G, He B, Li YQ. Raman spectroscopic analysis of apoptosis of single human gastric cancer cells. Vib Spectrosc. 2009;50:193-197. [DOI] [Cited in This Article: ] |
| 21. | Anderle G, Mendelsohn R. Thermal denaturation of globular proteins. Fourier transform-infrared studies of the amide III spectral region. Biophys J. 1987;52:69-74. [PubMed] [DOI] [Cited in This Article: ] [Cited by in Crossref: 110] [Cited by in F6Publishing: 104] [Article Influence: 2.8] [Reference Citation Analysis (0)] |
| 22. | Desroches J, Jermyn M, Pinto M, Picot F, Tremblay MA, Obaid S, Marple E, Urmey K, Trudel D, Soulez G. A new method using Raman spectroscopy for in vivo targeted brain cancer tissue biopsy. Sci Rep. 2018;8:1792. [PubMed] [DOI] [Cited in This Article: ] [Cited by in Crossref: 135] [Cited by in F6Publishing: 118] [Article Influence: 19.7] [Reference Citation Analysis (0)] |
| 23. | McGregor HC, Short MA, McWilliams A, Shaipanich T, Ionescu DN, Zhao J, Wang W, Chen G, Lam S, Zeng H. Real-time endoscopic Raman spectroscopy for in vivo early lung cancer detection. J Biophotonics. 2017;10:98-110. [PubMed] [DOI] [Cited in This Article: ] [Cited by in Crossref: 67] [Cited by in F6Publishing: 39] [Article Influence: 5.6] [Reference Citation Analysis (0)] |
| 24. | Wang J, Lin K, Zheng W, Ho KY, Teh M, Yeoh KG, Huang Z. Simultaneous fingerprint and high-wavenumber fiber-optic Raman spectroscopy improves in vivo diagnosis of esophageal squamous cell carcinoma at endoscopy. Sci Rep. 2015;5:12957. [PubMed] [DOI] [Cited in This Article: ] [Cited by in Crossref: 39] [Cited by in F6Publishing: 43] [Article Influence: 4.8] [Reference Citation Analysis (0)] |
| 25. | Bergholt MS, Lin K, Wang J, Zheng W, Xu H, Huang Q, Ren JL, Ho KY, Teh M, Srivastava S. Simultaneous fingerprint and high-wavenumber fiber-optic Raman spectroscopy enhances real-time in vivo diagnosis of adenomatous polyps during colonoscopy. J Biophotonics. 2016;9:333-342. [PubMed] [DOI] [Cited in This Article: ] [Cited by in Crossref: 60] [Cited by in F6Publishing: 59] [Article Influence: 7.4] [Reference Citation Analysis (0)] |
| 26. | Rutledge LC, Gupta RK, Elshenawy KB. Evaluation of the cotton fabric model for screening topical mosquito repellents. J Am Mosq Control Assoc. 1989;5:73-76. [PubMed] [Cited in This Article: ] |
| 27. | Kreicbergs A. DNA cytometry of musculoskeletal tumors. A review. Acta Orthop Scand. 1990;61:282-297. [PubMed] [Cited in This Article: ] |
| 28. | Jones LW, O'Toole C. Correlation of primary tumor bed lymphocytic infiltration and peripheral lymphocyte cytotoxicity in patients with transitional cell carcinoma. Natl Cancer Inst Monogr. 1978;183-185. [PubMed] [Cited in This Article: ] |
| 29. | Rahir G, Moser M. Tumor microenvironment and lymphocyte infiltration. Cancer Immunol Immunother. 2012;61:751-759. [PubMed] [DOI] [Cited in This Article: ] [Cited by in Crossref: 50] [Cited by in F6Publishing: 55] [Article Influence: 4.6] [Reference Citation Analysis (0)] |
| 30. | Zhao J, Lui H, McLean DI, Zeng H. Automated autofluorescence background subtraction algorithm for biomedical Raman spectroscopy. Appl Spectrosc. 2007;61:1225-1232. [PubMed] [DOI] [Cited in This Article: ] [Cited by in Crossref: 551] [Cited by in F6Publishing: 373] [Article Influence: 21.9] [Reference Citation Analysis (0)] |


