Published online Nov 18, 2017. doi: 10.4254/wjh.v9.i32.1227
Peer-review started: August 7, 2017
First decision: September 13, 2017
Revised: October 9, 2017
Accepted: October 30, 2017
Article in press: October 30, 2017
Published online: November 18, 2017
To clarify the histological changes associated with liver atrophy after percutaneous transhepatic portal embolization (PTPE) in pigs and humans.
As a preliminary study, we performed pathological examinations of liver specimens from five pigs that had undergone PTPE in a time-dependent model of liver atrophy. In specimens from embolized lobes (EMB) and nonembolized lobes (controls), we measured the portal vein to central vein distance (PV-CV), the area and number of hepatocytes per lobule, and apoptotic activity using the terminal deoxynucleotidyl transferase dUTP nick-end labeling assay. Immunohistochemical reactivities were evaluated for light chain 3 (LC3) and lysosomal-associated membrane protein 2 (LAMP2) as autophagy markers and for glutamine synthetase and cytochrome P450 2E1 (CYP2E1) as metabolic zonation markers. Samples from ten human livers taken 20-36 d after PTPE were similarly examined.
PV-CVs and lobule areas did not differ between EMB and controls at day 0, but were lower in EMB than in controls at weeks 2, 4, and 6 (P ≤ 0.001). Hepatocyte numbers were not significantly reduced in EMB at day 0 and week 2 but were reduced at weeks 4 and 6 (P ≤ 0.05). Apoptotic activity was higher in EMB than in controls at day 0 and week 4. LC3 and LAMP2 staining peaked in EMB at week 2, with no significant difference between EMB and controls at weeks 4 and 6. Glutamine synthetase and CYP2E1 zonation in EMB at weeks 2, 4, and 6 were narrower than those in controls. Human results were consistent with those of porcine specimens.
The mechanism of liver atrophy after PTPE has two histological phases: Hepatocellular atrophy is likely caused by autophagy in the first 2 wk and apoptosis thereafter.
Core tip: Liver atrophy after percutaneous transhepatic portal embolization (PTPE) in time-independent human studies is associated with hepatocyte shrinkage and apoptosis. In this preliminary study, we performed pathological examinations of liver specimens from five pigs that had undergone PTPE in a time-dependent model of liver atrophy. Two distinct phases of liver atrophy were identified: A hepatocellular atrophic phase, which may relate to autophagy, and an apoptotic phase. Despite liver atrophy appearing to be mostly resolved 2 wk after embolization, the period after PTPE could beneficially be extended to 4 wk to ensure contralateral hypertrophy and to allow the completion of liver atrophy.
- Citation: Iwao Y, Ojima H, Kobayashi T, Kishi Y, Nara S, Esaki M, Shimada K, Hiraoka N, Tanabe M, Kanai Y. Liver atrophy after percutaneous transhepatic portal embolization occurs in two histological phases: Hepatocellular atrophy followed by apoptosis. World J Hepatol 2017; 9(32): 1227-1238
- URL: https://www.wjgnet.com/1948-5182/full/v9/i32/1227.htm
- DOI: https://dx.doi.org/10.4254/wjh.v9.i32.1227
The interruption of portal blood flow by portal vein embolization or tumor thrombosis, for example, causes liver atrophy[1]. However, the mechanisms responsible for this effect have not been fully elucidated. Using pig models of percutaneous transhepatic portal vein embolization (PTPE) with absolute ethanol, we previously observed the temporary elevation of serum levels of liver enzymes immediately after ethanol injection. Moreover, in our previous report, macroscopic liver atrophy accompanied by an increased future liver remnant (FLR)/total estimated liver volume ratio was evident 2 wk after PTPE[2]. These observations suggest that the mechanisms responsible for liver atrophy likely commence soon after the disruption of portal blood flow. Consequently, histopathological changes would likely also be observed soon after PTPE.
In pigs that had undergone PTPE using a combination of coils and polyvinyl alcohol particles, the lobule size in the embolized lobe relative to normal liver reportedly decreased gradually to 23% at 12 d; after 12 d, the size of the embolized lobe remained constant[3]. Therefore, to clarify the mechanisms responsible for liver atrophy, pathological analysis should be carried out within this time period. However, to the best of our knowledge, such time-course studies have not yet been carried out.
To assess microscopic changes in liver tissues, it is important to study liver lobules, the smallest functional units of the liver. The observation of clear histological changes would be expected when hepatic blood inflow is disturbed and would be dependent on lobule metabolism, which varies in different zones of the lobule. In particular, we focused on the zonation associated with different levels of metabolism, as illuminated by immunohistochemical (IHC) staining for glutamine synthetase (GS)[4] and cytochrome P450 2E1 (CYP2E1)[5]. Both markers were observed in the pericentral zone of lobules.
Recently, the relationship between apoptosis and autophagy has been extensively reported[6]. The molecular mechanism of autophagy was illuminated by the discoveries of the membrane protein autophagy-related gene 5 in yeast and the microtubule-associated protein 1 light chain 3 (LC3) in mammals[7]. Consequently, IHC staining for these proteins can be used to evaluate levels of autophagy[8,9]. Recent studies have used lysosomal-associated membrane protein 2 (LAMP2) to evaluate autophagy because it is related to autolysosomes for some kinds of autophagy[10]. Autophagy in the liver is reportedly caused by starvation and is related to hepatocellular atrophy[11]. The interruption of portal blood flow, which contains a wealth of nutrients[12], is considered a form of starvation. Therefore, autophagy may be related to both cellular shrinking and apoptosis. However, the relationship between portal venous obstruction and autophagy has not been reported.
The aim of this study was to investigate, using specimens from a previously reported porcine PTPE model[2], the microscopic changes associated with apoptosis and autophagy in the days and weeks following portal venous obstruction and to clarify the mechanism by which interrupted portal blood flow causes liver atrophy. Furthermore, we sought to verify the integrity of our pig results by performing the same histopathological investigations in specimens resected from human patients who had undergone PTPE[13-16].
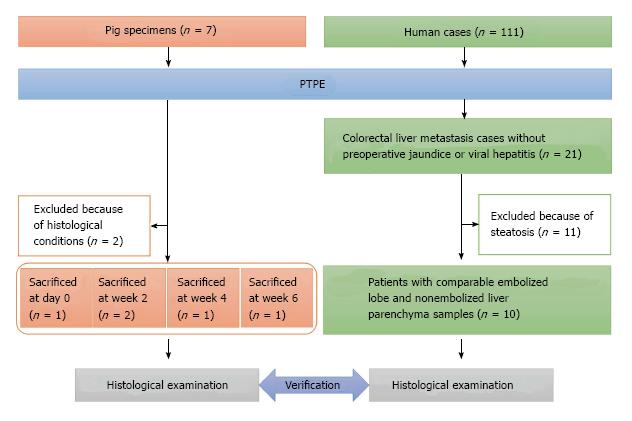
Liver specimens obtained from seven female domestic pigs (Saitama Experimental Animal Supply, Saitama, Japan) weighing 30.0-35.0 kg were used in this study. All pigs underwent segmental PTPE under fluoroscopic guidance with injection of 10 mL absolute ethanol, as we described previously[2]. Specimens from two pigs were excluded from this study because their quality was unsuitable for pathological analysis. Finally, specimens from five pigs were selected for analysis; one pig was sacrificed on day 0, two pigs at week 2, one pig at week 4, and one pig at week 6 (Figure 1).
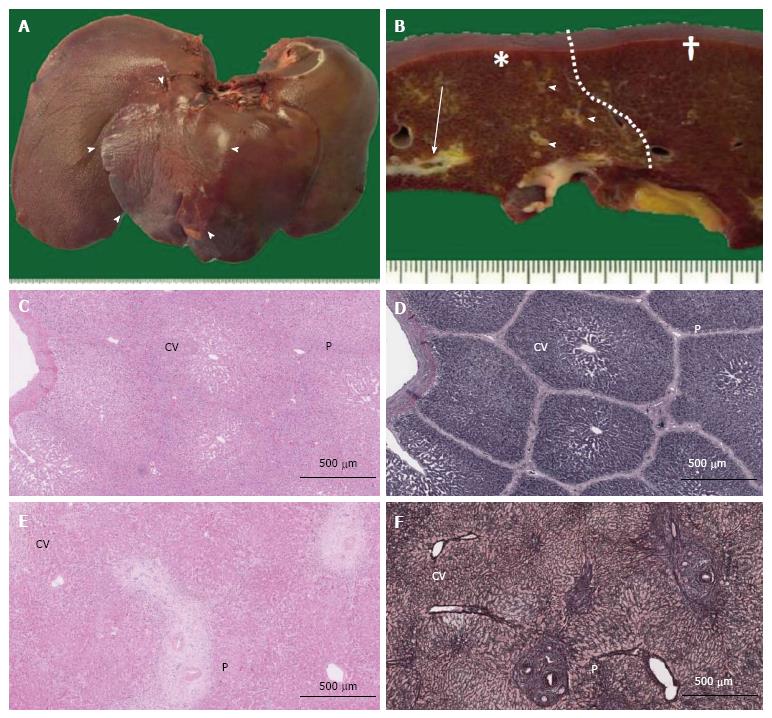
The removed pig livers were observed macroscopically (Figure 2A and B). No pig livers exhibited bleeding, degeneration, or necrosis. To evaluate the pure histological changes of the embolized area compared with those of the nonembolized area without histological regenerative reactions, formalin-fixed paraffin-embedded specimens were produced from samples resected from the embolized segment and a nonembolized lobe (control) far from the lobe containing the embolized segment.
Formalin-fixed paraffin-embedded specimens obtained from 111 patients who underwent major hepatectomy with preoperative PTPE between 2004 and 2010 were collected at the Hepatobiliary Pancreatic Surgery Division of the National Cancer Center Hospital, Tokyo, Japan. Of these 111 patients, 21 had colorectal liver metastases without preoperative jaundice or viral hepatitis. To facilitate the histological evaluation of liver lobules, 11 patients were excluded because of steatosis. In total, 10 patients with comparable embolized lobe and nonembolized liver parenchyma samples (e.g., the caudate lobe or partial hepatectomy from contralateral lobe of PTPE) were selected (Figure 1). All patients (male-to-female ratio: 4:6, median age: 59 years, range: 43-76 years) underwent hepatectomy with PTPE based on their individual clinical status (Table 1), and samples were collected between 20 and 36 d later (median: 22 d). All patients underwent PTPE via the ipsilateral approach using a 21-G needle (Top, Tokyo, Japan) under ultrasonographic guidance. A 5-Fr sheath (introducer set, Medikit, Tokyo, Japan) was introduced into a branch of the portal vein under fluoroscopic guidance and a 5-Fr balloon catheter (Selection Balloon Catheter, Terumo Clinical Supply, Gifu, Japan) was used for the injection of absolute ethanol (99.5% ethanol, Fuso Pharmaceutical Industries, Osaka, Japan). The study was approved by the Ethics Committee of our institution. All patients gave written informed consent for inclusion in this study (ID: 2007-022).
| Patient | Gender | Age (yr) | Primary tumor site | Surgery |
| 1 | F | 74 | Rectum | Ex Rt |
| 2 | F | 57 | Rectum | Ex Rt |
| 3 | M | 76 | Cecum | Ex Rt |
| 4 | M | 43 | S/C | Ex Rt |
| 5 | M | 56 | Rectum | Ex Rt |
| 6 | M | 53 | Rectum | Ex Rt |
| + nonAnat S3 | ||||
| 7 | F | 47 | S/C | Ex Rt |
| 8 | F | 61 | Rectum | Ex Rt |
| 9 | F | 64 | S/C | Ex Rt |
| 10 | F | 63 | Rectum | Ex Rt |
| + nonAnat S3 |
All histological examinations were carried out using digital images scanned by Nanozoomer Digital Pathology (NDP, Hamamatsu Photonics, Hamamatsu, Japan) evaluated by two experienced pathologists (Yasuhito Iwao and Hidenori Ojima) who were blinded to all experimental and clinical data. The pathologists conferred if the original evaluations differed.
Sections were stained with hematoxylin and eosin (HE), and the morphological changes in embolized and nonembolized lobules were evaluated at 50 random locations on NDP images. The distance between the endothelium of the portal vein in the portal triad and the associated central vein in the same lobule (PV-CV) and the cross sectional area of the lobule (which has a convex shape around a single central vein) were recorded. After the median lobule size (median, ± 0.100 mm2) of each group was determined, the number of hepatocytes in each lobule was counted for 20 randomly selected lobules (Figure 2C and D). Hepatocyte density was calculated by dividing the number of hepatocytes by the area of the counted lobule for pig specimens. For human specimens, the hepatocyte density was counted within 20 randomly selected 1-mm-diameter circles.
Apoptosis of hepatocytes was quantified by terminal deoxyribonucleotidyl transferase-mediated dUTP-digoxigenin nick-end labeling (TUNEL) assay (In situ cell death detection kit, POD, Roche Diagnostic, Mannheim, Germany). The proportion of TUNEL-positive hepatocytes was counted five times in ten random high-power fields.
Sections (4-μm thick) were deparaffinized and incubated in an autoclave for 10 min at 121 °C and 1.5 bar. IHC staining was performed using a polymer system (Dako, Glostrup, Denmark) with 3,3′-diaminobenzidine (DAB/Tris tablets, Muto Pure Chemicals, Tokyo, Japan) as the chromogen. A mouse monoclonal antibody (1:50, sc-271625, clone G-2, Santa Cruz Biotechnology, Santa Cruz, CA, United States) was used for LC3, a rabbit polyclonal antibody (1:100, bs-2379R, Bioss, Beijing, China) was used for LAMP2, a mouse monoclonal antibody (1:2000, MAB302, clone GS-6, Millipore, Billerica, United States) was used for GS, and a rabbit polyclonal antibody (1:100, bs-4562R, Bioss, Beijing, China) was used for CYP2E1. The sections were incubated for 2 h at room temperature.
After sections stained for LC3 were scanned and captured by NDP, the digital images were analyzed using ImageJ version 1.48 (National Institutes of Health, Bethesda, Maryland, United States). To facilitate comparisons between pig specimens, the IHC intensity of LC3 was evaluated for each lobule and then divided by the IHC intensity of nerve in the same portal area as the positive control.
Formalin-fixed pig liver specimens were analyzed using a Hitachi H-7650 (Hitachi, Tokyo, Japan) transmission electron microscope. Magnification at 80 kV achieved a clear depiction of the hepatocyte organelles.
Statistical analysis was performed with the Statistical Package for Social Sciences version 22 (SPSS Inc., Chicago, IL, United States). The Mann-Whitney U test was used to assess differences between embolized and nonembolized samples at each time point. For nonparametric multiple comparisons, the Kruskal-Wallis test was applied. Differences were considered significant at P < 0.05. Data are expressed as medians unless otherwise indicated.
The animal experiment protocols were described in our previous report[2]. All protocols were approved by the Committee for Ethics in Animal Experimentation and were conducted in accordance with the Guidelines for Animal Experiments of our institution (ID: K03-004).
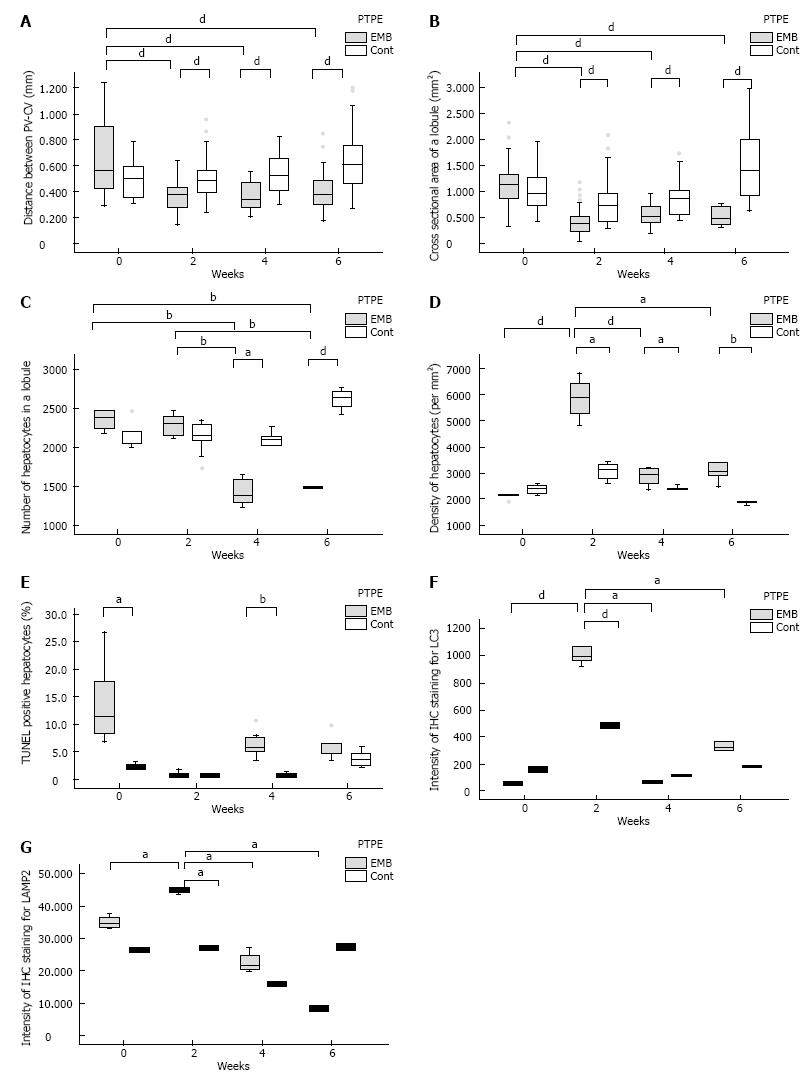
The PV-CV distance in embolized and control specimens did not differ significantly at day 0 (0.571 mm vs 0.485 mm, respectively). However, at weeks 2, 4, and 6, the PV-CV distance was significantly reduced in embolized specimens (week 2: 0.364 mm, week 4: 0.335 mm, and week 6: 0.372 mm, P < 0.001, P = 0.001, P = 0.001, respectively) compared with control specimens. Moreover, at weeks 2, 4, and 6, the PV-CV distance was significantly reduced in embolized specimens compared with embolized specimens at day 0 (P < 0.001, P = 0.001, P = 0.001, respectively) (Figure 3A). The lobule cross sections of embolized specimens at weeks 2, 4, and 6 (week 2: 0.368 mm2, week 4: 0.532 mm2, and week 6: 0.462 mm2) were significantly smaller than those of control specimens and were also smaller than embolized specimens at day 0 (1.096 mm2) (P < 0.001 for all) (Figure 3B). The PV-CV distances and lobule areas in embolized specimens at weeks 2, 4, and 6 did not differ significantly.
The number of hepatocytes in lobules of median size did not differ significantly between embolized and control specimens until 4 wk after PTPE (week 4: 1459 and 2055, respectively, P = 0.025; week 6: 1494 and 2642, P < 0.001). At weeks 4 and 6, the number of hepatocytes per median-sized lobule in embolized specimens was significantly smaller than those in embolized and in control specimens at day 0 and week 2 (P < 0.001 for all) (Figure 3C). Therefore, the hepatocyte density in embolized specimens peaked at week 2 (5878/mm2) (Figure 3D).
The fraction of TUNEL-positive hepatocytes was higher in embolized than in control specimens at day 0 and week 4 (11.1% vs 2.37% on day 0 and 5.51% vs 0.493% at week 4, P = 0.018, P = 0.009, respectively; Figure 3E).
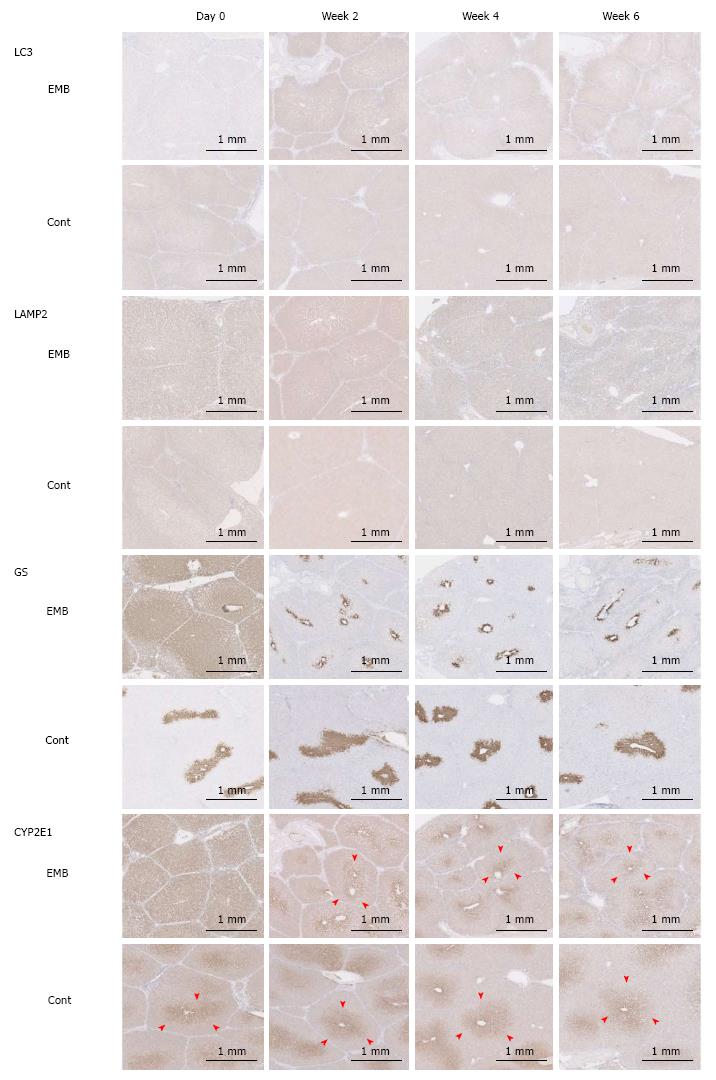
The IHC intensity, as measured by Image J, for LC3 and LAMP2 in embolized specimens at week 2 (0.994 and 45.4, respectively) was significantly higher than that in control specimens (0.486, P = 0.046 and 27.0, P = 0.014, respectively). Moreover, the LC3 and LAMP2 intensities of embolized specimens at week 2 were significantly higher than those in all other specimens (P ≤ 0.025 and P ≤ 0.014 for all; Figure 3F, G and Figure 4). GS and CYP2E1 staining intensities in embolized specimens were not closely associated with those of control specimens at day 0. The extent of the stained zones decreased after 2 wk (Figure 4).
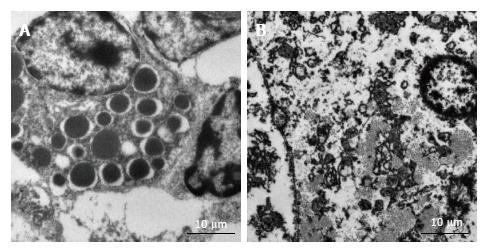
Clear findings were hard to establish because of the poor condition of pig liver specimens that had been fixed in formalin some time previously. There was the suggestion of a peak of autophagic vacuoles in embolized samples at week 2 (Figure 5), which was consistent with the IHC staining intensity of LC3.
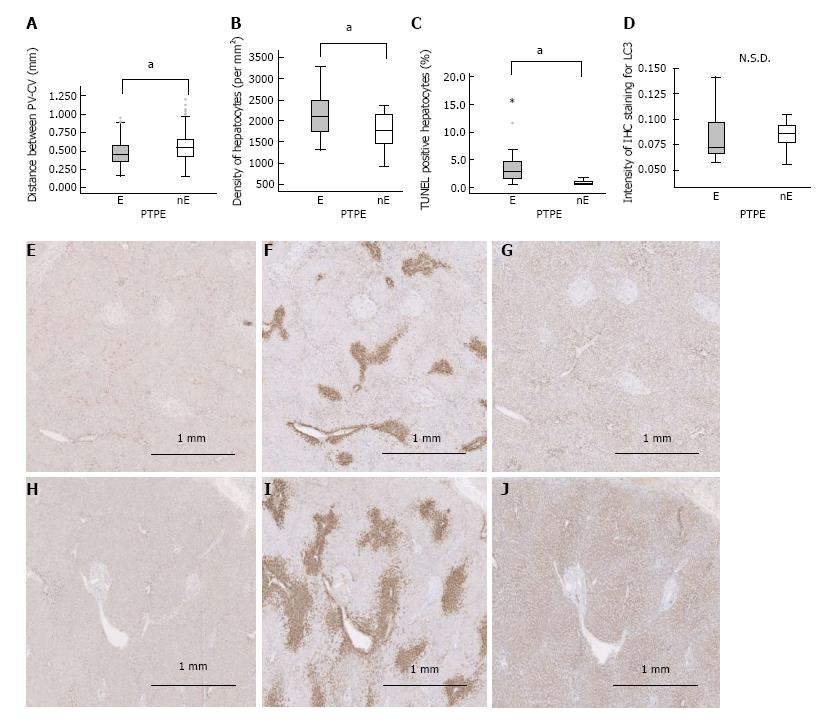
We sought to validate our findings in porcine samples by repeating the analytical procedures in human liver specimens from patients following PTPE. Because human lobule structures are not as well defined as those in porcine specimens, the PV-CV distance and hepatocyte density were assessed in a morphological study (Figure 2E and F). PV-CV was significantly shorter in embolized specimens than in nonembolized specimens (0.455 mm vs 0.563 mm, P < 0.001) (Figure 6A), as was also observed in porcine specimens 4 wk after PTPE. The hepatocyte density in embolized specimens was significantly higher than that in nonembolized specimens (2111/mm2vs 1772/mm2, P = 0.038) (Figure 6B).
A significantly greater fraction of hepatocytes was TUNEL-positive in embolized specimens than in nonembolized specimens (2.804% vs 0.559%, P < 0.001) (Figure 6C). However, the LC3 intensity did not differ significantly between embolized and nonembolized specimens (Figure 6D, E and H). The extents of GS and CYP2E1 zonation were reduced in embolized specimens compared with nonembolized specimens (Figure 6F, G, I and J); similar results were observed in porcine specimens collected 4 wk after PTPE.
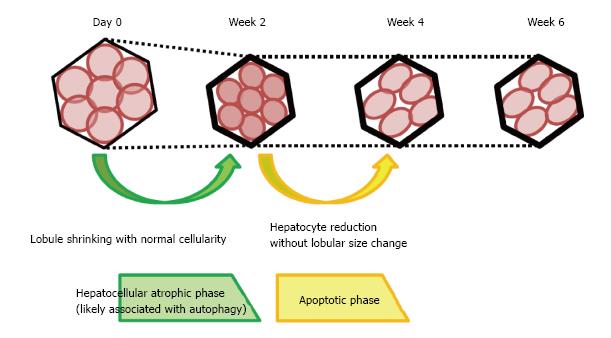
Interruption of the portal blood flow causes shrinkage of the embolized lobe and compensatory enlargement of the nonembolized lobes. The effects of portal venous obstruction on hepatocyte volume and apoptosis have been previously reported[13-16]. However, these studies used only human specimens in which the atrophy process was complete. As a result, the process of liver atrophy could not be studied in detail. Our morphological study focused on changes in the lobules over time in porcine samples. We observed two distinct phases of liver atrophy following portal blood flow disruption. The first phase was characterized by lobule shrinkage without a fall in the number of hepatocytes and was accompanied by strong expressions of LC3 and LAMP2 in the first 2 wk after portal venous obstruction. The second phase, which occurred between 2 and 4 wk after portal venous obstruction, was characterized by a reduction in the number of hepatocytes without changes in lobular size. This reduction was accompanied by decreased LC3 and LAMP2 intensity and an increased fraction of TUNEL-positive cells (Figure 7).
Soon after the injection of ethanol, the zonation of GS and CYP2E1 in embolized specimens expanded markedly. Increased GS zonation could represent accelerated ammonia metabolism resulting from the degradation of denatured proteins[17]. Moreover, it has been reported that CYP2E1 is directly associated with ethanol metabolism[18]. Furthermore, in this study, the fraction of TUNEL-positive hepatocytes was observed to increase in embolized specimens at day 0; this finding may reflect damage caused by ethanol. Hepatocytes in the embolized lobule may degenerate soon after ethanol injection. These changes are consistent with the clinical observation that circulating levels of transaminases are transiently elevated after ethanol injection to patients undergoing portal vein embolization[19]. In addition, we found that the proportion of TUNEL-positive hepatocytes decreased in the first 2 wk and did not differ between embolized and control specimens at week 2. However, hepatocyte numbers were reported to be restored in 3-4 d after partial hepatectomy[20], and hepatocyte replication in the embolized lobe was reported to be slightly increased approximately 7 d after PTPE with coils and particles[3]. Perhaps the cellular damage observed at day 0 in our study was repaired via regeneration within the first few days.
The PV-CV distance and lobule size were reduced without the loss of hepatocytes in embolized specimens at week 2. This first phase could be considered a hepatocellular atrophic phase. Interruption of the portal blood flow (which is rich in nutrients from the gastrointestinal tract) may starve hepatocytes after embolization. Starvation reportedly causes autophagy and hepatocyte atrophy[11]. Interestingly, in our study, LC3 and LAMP2 expression was significantly increased in embolized specimens at week 2. Simultaneously, GS and CYP2E1 zonation were reduced at week 2 as starvation caused a reduction in metabolism. Moreover, we found an increase in the number of autophagic vacuoles in embolized specimens at week 2. Thus, we speculated that disruption of the portal blood flow caused hepatocyte shrinkage by activating autophagy.
Between weeks 2 and 4, the number of hepatocytes in embolized specimens decreased without significant changes in the lobule size. During the same period, LC3 and LAMP2 expressions fell and a larger proportion of hepatocytes became TUNEL-positive. Consequently, this phase may be regarded as encompassing the deactivation of autophagy and the activation of apoptosis. Recently, autophagy was reported to induce cell death[21]. Therefore, the TUNEL-positive cell death we observed might represent caspase-independent apoptosis, rather than caspase-dependent apoptosis[22]. Because hepatocyte numbers decreased while TUNEL-positive staining increased after the activation of autophagy, we characterized the phase occurring 2-4 wk after PTPE as the “apoptotic phase”. During this phase, the zonation of GS and CYP2E1 did not differ significantly from that observed in embolized specimens at week 2. Between weeks 4 and 6, no morphological or IHC changes were observed at the lobular level and no significant difference was observed in the proportion of TUNEL-positive cells between embolized and control specimens at week 6. Therefore, the liver atrophy process likely terminates between weeks 4 and 6. Our results corroborate that FLR hypertrophy usually takes 4 wk to complete after PTPE because the liver atrophy process is not complete until week 4, although it appears at the macro level to have resolved by week 2.
Hepatectomy is usually performed around 4 wk after PTPE. Consequently, we sought to validate our porcine model observations in human specimens. The observations we made concerning the PV-CV distance, hepatocyte density, TUNEL staining, LC3 and LAMP2 expression, and GS and CYP2E1 zonation in embolized and nonembolized specimens at 4 wk after PTPE in porcine samples also applied to human specimens taken between 20 and 36 d after PTPE. Moreover, the TUNEL results supported those already reported for clinical samples[14-17]. Furthermore, the pigs we used underwent the same PTPE protocol that humans undergo clinically. Because the histological observations made using this porcine model did not contradict the human results (Table 2), the mechanism by which the interruption of portal blood flow causes liver atrophy may be similar in pigs and in humans.
| Pig liver specimens at week 4 | Human liver specimens resected around week 4 | |
| PV-CV distance | EMB < Cont | EMB < nonEMB |
| Hepatocyte density | EMB > Cont | EMB > nonEMB |
| TUNEL-positive cells | EMB > Cont | EMB > nonEMB |
| LC3 Intensity | N.S.D. | N.S.D. |
| GS zonation | EMB narrower than Cont | EMB narrower than nonEMB |
| CYP2E1 zonation | EMB narrower than Cont | EMB narrower than nonEMB |
The limitations of this preliminary study were that the number of pigs was insufficient for a detailed histopathological study to provide unequivocal evidence of the relationship between hepatocellular atrophy and autophagy. Further we attempted Western blotting for LC3-II, but it was not successful. However, we believe that our results and speculations provide a basis for understanding the mechanism of liver atrophy after interruption of the portal blood flow and will facilitate further study. Future research will hopefully provide a sound theoretical basis for planning treatment strategies for acute portal obstruction-related liver dysfunction or disease and chronic ischemic-related liver diseases with liver atrophy.
In conclusion, to investigate the mechanism by which portal vein obstruction causes liver atrophy, we investigated the histological changes in pig livers following PTPE and observed two distinct phases. The first phase, termed the hepatocellular atrophic phase, is characterized by lobular shrinkage without hepatocyte loss and with high levels of LC3 and LAMP2 expression. This phase lasted for the first 2 wk following PTPE. The second phase, which occurs between weeks 2 and 4, is termed the apoptotic phase and is characterized by a reduction in hepatocyte numbers without a reduction in lobular size. This is accompanied by reduced LC3 and LAMP2 expression and increased TUNEL staining. Human liver specimens resected after PTPE had many similar characteristics to specimens collected from pigs at week 4. Therefore, our findings suggest that the mechanism by which the interruption of portal blood flow causes liver atrophy may be similar in pigs and in humans.
The interruption of portal blood flow by portal vein embolization or tumor thrombosis, for example, causes liver atrophy. However, the mechanisms responsible for this effect have not been fully elucidated.
The previous study suggested that the mechanisms responsible for liver atrophy likely commence soon after the disruption of portal blood flow. Consequently, histopathological changes would likely also be observed soon after percutaneous transhepatic portal embolization (PTPE). Recently, the relationship between apoptosis and autophagy has been extensively reported. Autophagy in the liver is reportedly caused by starvation and is related to hepatocellular atrophy, and, moreover, interruption of the portal blood flow, which contains a wealth of nutrients, is considered a form of starvation. Therefore, autophagy may be related to both cellular shrinking and apoptosis. However, the relationship between portal venous obstruction and autophagy has not been reported. To clarify the mechanisms responsible for liver atrophy, histopathological analysis should be carried out repeatedly within the first few weeks after PTPE. However, to the best of our knowledge, such time-course studies have not yet been carried out. The results and hypotheses will provide a basis for understanding the mechanism of liver atrophy after interruption of the portal blood flow and will facilitate further study.
The aim of this study was to investigate, using specimens from a previously reported porcine PTPE model, the microscopic changes associated with apoptosis and autophagy in the days and weeks following portal venous obstruction and to clarify the mechanism by which interrupted portal blood flow causes liver atrophy. Furthermore, to understand the mechanism of liver atrophy in humans after PTPE, the authors sought to verify the integrity of the pig results by performing the same histopathological investigations in specimens resected from human patients who had undergone PTPE.
The authors performed histopathological examinations of liver specimens from five pigs that had undergone PTPE in a time-dependent model of liver atrophy. In specimens from embolized lobes (EMB) and nonembolized lobes (controls), the authors measured the portal vein to central vein distance (PV-CV), the area and number of hepatocytes per lobule, and apoptotic activity using the terminal deoxynucleotidyl transferase dUTP nick-end labeling assay. Immunohistochemical reactivities were evaluated for light chain 3 (LC3) and lysosomal-associated membrane protein 2 (LAMP2) as autophagy markers and for glutamine synthetase and cytochrome P450 2E1 (CYP2E1) as metabolic zonation markers. Samples from ten human livers taken 20-36 d after PTPE were similarly examined.
PV-CVs and lobule areas did not differ between EMB and controls at day 0, but were lower in EMB than in controls at weeks 2, 4, and 6. Hepatocyte numbers were not significantly reduced in EMB at day 0 and week 2 but were reduced at weeks 4 and 6. Apoptotic activity was higher in EMB than in controls at day 0 and week 4. LC3 and LAMP2 staining peaked in EMB at week 2, with no significant difference between EMB and controls at weeks 4 and 6. Glutamine synthetase and CYP2E1 zonation in EMB at weeks 2, 4, and 6 were narrower than those in controls. Human results were consistent with those of porcine specimens. However the number of pigs was insufficient for a detailed histopathological study to provide unequivocal evidence of the relationship between hepatocellular atrophy and autophagy.
To investigate the mechanism by which portal vein obstruction causes liver atrophy, the authors examined the histological changes in pig livers following PTPE and observed two distinct phases. The first phase, termed the hepatocellular atrophic phase, is characterized by lobular shrinkage without hepatocyte loss and with high levels of LC3 and LAMP2 expression. This phase lasted for the first 2 wk following PTPE. The second phase, which occurs between weeks 2 and 4, is termed the apoptotic phase and is characterized by a reduction in hepatocyte numbers without a reduction in lobular size. This is accompanied by reduced LC3 and LAMP2 expression and increased TUNEL staining. Human liver specimens resected after PTPE had many similar characteristics to specimens collected from pigs at week 4. Despite liver atrophy appearing to be mostly resolved 2 wk after embolization, the period after PTPE could beneficially be extended to 4 wk to ensure contralateral hypertrophy and to allow the completion of liver atrophy.
Histopathological analysis is the best way to clarify the mechanisms responsible for liver atrophy. To assess microscopic changes in liver tissues, it is important to study liver lobules, the smallest functional units of the liver. The observation of clear histological changes would be expected. To clarify the more detailed mechanism of liver atrophy after interruption of the portal blood flow, the authors have to study the histopathological changes using not only the pig model but also small animal models, e.g., mouse models, because such animals are easy to handle. After such detailed studies, future research will hopefully provide a basis for understanding the mechanism of liver atrophy after interruption of the portal blood flow and also give a sound theoretical basis for planning treatment strategies for acute portal obstruction-related liver dysfunction or disease and chronic ischemic-related liver diseases with liver atrophy.
The authors thank Dr. Mitsuo Satake for the management of the animal experiments. The authors also thank Dr. Seri Yamagishi for veterinary support, medical technicians Ms. Hiroe Nozaki, Mr. Hitoshi Abe, and Mr. Satoru Kusakari for assistance with the experiments and Mr. David Smallbones for detailed English editing and valuable advice.
Manuscript source: Invited manuscript
Specialty type: Gastroenterology and hepatology
Country of origin: Japan
Peer-review report classification
Grade A (Excellent): 0
Grade B (Very good): 0
Grade C (Good): C
Grade D (Fair): 0
Grade E (Poor): 0
P- Reviewer: Bubnov RV S- Editor: Qi Y L- Editor: A E- Editor: Lu YJ
| 1. | Makuuchi M, Thai BL, Takayasu K, Takayama T, Kosuge T, Gunvén P, Yamazaki S, Hasegawa H, Ozaki H. Preoperative portal embolization to increase safety of major hepatectomy for hilar bile duct carcinoma: a preliminary report. Surgery. 1990;107:521-527. [PubMed] [Cited in This Article: ] |
| 2. | Satake M, Tateishi U, Kobayashi T, Murata S, Kumazaki T. Percutaneous transhepatic portal vein embolization: effectiveness of absolute ethanol infusion with balloon catheter in a pig model. Acta Radiol. 2005;46:344-352. [PubMed] [Cited in This Article: ] |
| 3. | Duncan JR, Hicks ME, Cai SR, Brunt EM, Ponder KP. Embolization of portal vein branches induces hepatocyte replication in swine: a potential step in hepatic gene therapy. Radiology. 1999;210:467-477. [PubMed] [DOI] [Cited in This Article: ] [Cited by in Crossref: 52] [Cited by in F6Publishing: 53] [Article Influence: 2.1] [Reference Citation Analysis (0)] |
| 4. | Gebhardt R, Burger HJ, Heini H, Schreiber KL, Mecke D. Alterations of hepatic enzyme levels and of the acinar distribution of glutamine synthetase in response to experimental liver injury in the rat. Hepatology. 1988;8:822-830. [PubMed] [Cited in This Article: ] |
| 5. | Lindros KO. Zonation of cytochrome P450 expression, drug metabolism and toxicity in liver. Gen Pharmacol. 1997;28:191-196. [PubMed] [Cited in This Article: ] |
| 6. | Maiuri MC, Zalckvar E, Kimchi A, Kroemer G. Self-eating and self-killing: crosstalk between autophagy and apoptosis. Nat Rev Mol Cell Biol. 2007;8:741-752. [PubMed] [DOI] [Cited in This Article: ] [Cited by in Crossref: 2430] [Cited by in F6Publishing: 2658] [Article Influence: 156.4] [Reference Citation Analysis (0)] |
| 7. | Mizushima N, Noda T, Yoshimori T, Tanaka Y, Ishii T, George MD, Klionsky DJ, Ohsumi M, Ohsumi Y. A protein conjugation system essential for autophagy. Nature. 1998;395:395-398. [PubMed] [DOI] [Cited in This Article: ] [Cited by in Crossref: 1205] [Cited by in F6Publishing: 1224] [Article Influence: 47.1] [Reference Citation Analysis (0)] |
| 8. | Martinet W, Timmermans JP, De Meyer GR. Methods to assess autophagy in situ--transmission electron microscopy versus immunohistochemistry. Methods Enzymol. 2014;543:89-114. [PubMed] [DOI] [Cited in This Article: ] [Cited by in Crossref: 44] [Cited by in F6Publishing: 48] [Article Influence: 5.3] [Reference Citation Analysis (0)] |
| 9. | Kashima J, Shintani-Ishida K, Nakajima M, Maeda H, Unuma K, Uchiyama Y, Yoshida K. Immunohistochemical study of the autophagy marker microtubule-associated protein 1 light chain 3 in normal and steatotic human livers. Hepatol Res. 2014;44:779-787. [PubMed] [DOI] [Cited in This Article: ] [Cited by in Crossref: 25] [Cited by in F6Publishing: 30] [Article Influence: 3.0] [Reference Citation Analysis (0)] |
| 10. | Watanabe Y, Honda S, Konishi A, Arakawa S, Murohashi M, Yamaguchi H, Torii S, Tanabe M, Tanaka S, Warabi E. Autophagy controls centrosome number by degrading Cep63. Nat Commun. 2016;7:13508. [PubMed] [DOI] [Cited in This Article: ] [Cited by in Crossref: 29] [Cited by in F6Publishing: 29] [Article Influence: 3.6] [Reference Citation Analysis (0)] |
| 11. | Pfeifer U. Cellular autophagy and cell atrophy in the rat liver during long-term starvation. A quantitative morphological study with regard to diurnal variations. Virchows Arch B Cell Pathol. 1973;12:195-211. [PubMed] [Cited in This Article: ] |
| 12. | Lautt WW, Greenway CV. Conceptual review of the hepatic vascular bed. Hepatology. 1987;7:952-963. [PubMed] [Cited in This Article: ] |
| 13. | Harada H, Imamura H, Miyagawa S, Kawasaki S. Fate of the human liver after hemihepatic portal vein embolization: cell kinetic and morphometric study. Hepatology. 1997;26:1162-1170. [PubMed] [DOI] [Cited in This Article: ] [Cited by in Crossref: 2] [Cited by in F6Publishing: 14] [Article Influence: 0.5] [Reference Citation Analysis (0)] |
| 14. | Fujii Y, Shimada H, Endo I, Kamiyama M, Kamimukai N, Tanaka K, Kunisaki C, Sekido H, Togo S, Nagashima Y. Changes in clinicopathological findings after portal vein embolization. Hepatogastroenterology. 2000;47:1560-1563. [PubMed] [Cited in This Article: ] |
| 15. | Kusaka K, Imamura H, Tomiya T, Takayama T, Makuuchi M. Expression of transforming growth factor-alpha and -beta in hepatic lobes after hemihepatic portal vein embolization. Dig Dis Sci. 2006;51:1404-1412. [PubMed] [DOI] [Cited in This Article: ] [Cited by in Crossref: 18] [Cited by in F6Publishing: 19] [Article Influence: 1.1] [Reference Citation Analysis (0)] |
| 16. | Komori K, Nagino M, Nimura Y. Hepatocyte morphology and kinetics after portal vein embolization. Br J Surg. 2006;93:745-751. [PubMed] [DOI] [Cited in This Article: ] [Cited by in Crossref: 33] [Cited by in F6Publishing: 36] [Article Influence: 2.0] [Reference Citation Analysis (0)] |
| 17. | Adeva MM, Souto G, Blanco N, Donapetry C. Ammonium metabolism in humans. Metabolism. 2012;61:1495-1511. [PubMed] [DOI] [Cited in This Article: ] [Cited by in Crossref: 171] [Cited by in F6Publishing: 162] [Article Influence: 13.5] [Reference Citation Analysis (0)] |
| 18. | Morimoto M, Hagbjörk AL, Wan YJ, Fu PC, Clot P, Albano E, Ingelman-Sundberg M, French SW. Modulation of experimental alcohol-induced liver disease by cytochrome P450 2E1 inhibitors. Hepatology. 1995;21:1610-1617. [PubMed] [Cited in This Article: ] |
| 19. | Sofue K, Arai Y, Shimada K, Takeuchi Y, Kobayashi T, Satake M, Sugimura K. Right portal vein embolization with absolute ethanol in major hepatic resection for hepatobiliary malignancy. Br J Surg. 2014;101:1122-1128. [PubMed] [DOI] [Cited in This Article: ] [Cited by in Crossref: 17] [Cited by in F6Publishing: 21] [Article Influence: 2.1] [Reference Citation Analysis (0)] |
| 20. | Duncan AW, Dorrell C, Grompe M. Stem cells and liver regeneration. Gastroenterology. 2009;137:466-481. [PubMed] [DOI] [Cited in This Article: ] [Cited by in Crossref: 381] [Cited by in F6Publishing: 383] [Article Influence: 25.5] [Reference Citation Analysis (0)] |
| 21. | Ryter SW, Mizumura K, Choi AM. The impact of autophagy on cell death modalities. Int J Cell Biol. 2014;2014:502676. [PubMed] [DOI] [Cited in This Article: ] [Cited by in Crossref: 174] [Cited by in F6Publishing: 180] [Article Influence: 18.0] [Reference Citation Analysis (0)] |
| 22. | Lockshin RA, Zakeri Z. Apoptosis, autophagy, and more. Int J Biochem Cell Biol. 2004;36:2405-2419. [PubMed] [DOI] [Cited in This Article: ] [Cited by in Crossref: 483] [Cited by in F6Publishing: 476] [Article Influence: 25.1] [Reference Citation Analysis (0)] |


