Published online Aug 27, 2010. doi: 10.4254/wjh.v2.i8.311
Revised: August 12, 2010
Accepted: August 17, 2010
Published online: August 27, 2010
AIM: To investigate the influence of mycophenolate mofetil (MMF) plus adriamycin (ADM) on hepatocellular carcinoma (HCC) cells.
METHODS: HCC cells were treated with 100 μg/ml of MMF alone (MMF group), 1 μg/mL of adriamycin (ADM group) alone, or a combination of the drugs (MMF + ADM group). We performed an 3-[4,5-dimethylthiazol-2-yl]-2,5-diphenyl tetrazolium bromide (MTT) assay to measure the growth inhibition rate of HCC cells. Flow cytometry was used to determine the percentage of cells in different phases of the cell cycle and the number of apoptotic cells. Hoechst 33258 staining revealed the morphological changes associated with apoptosis in HCC cells.
RESULTS: The results of MTT assays revealed that monotherapy with ADM or MMF showed inhibition of cell growth, while MMF + ADM therapy afforded an inhibition rate of more than 90% with cell distribution in G1 and G2/M phase greater than that in S phase. MMF + ADM treatment also downregulated Bcl-2 expression markedly. The growth of HCC cells was markedly inhibited and apoptosis was enhanced in all the 3 groups. Compared with other 2 groups, the MMF + ADM group showed more obvious apoptosis of cells.
CONCLUSION: The MMF plus ADM combination exerts remarkable inhibitory effects on the growth of HCC cells.
- Citation: Chu YK, Liu Y, Yin JK, Wang N, Cai L, Lu JG. Effect of mycophenolate mofetil plus adriamycin on HepG-2 cells. World J Hepatol 2010; 2(8): 311-317
- URL: https://www.wjgnet.com/1948-5182/full/v2/i8/311.htm
- DOI: https://dx.doi.org/10.4254/wjh.v2.i8.311
Hepatocellular carcinoma (HCC) is one of the most widespread malignant diseases. It is currently the fifth most common solid tumor worldwide and the fourth leading cause of cancer-related death. Therefore, finding new strategies for treatment of HCC is an important objective. Many methods have been established to treat HCC including surgery, chemotherapy with new antitumor drugs, interventive therapy, liver transplantation. Among these treatments, liver transplantation has been considered as one of the most curative options for HCC. It is reported that the current 1- and 5-year survival rates for HCC patients undergoing orthotopic liver transplantation are 77.0% and 61.1%, respectively. The 5-year survival rate has steadily improved from 25.3% in 1987 to 61.1% during the most recent period studied. Liver transplantation is now considered to be an effective method for the treatment of HCC, although there is still a significant rate of recurrence after transplantation.
Patients who have received immunosuppression following organ allotransplantation display an increased incidence of de novo neoplasms. Studies have identified some definite risk factors for malignancy, namely: aging, the quantity/quality of the administered immunosuppressive drugs. Mycophenolate mofetil (MMF) is a potent, reversible, noncompetitive inhibitor of leukaryotic inosine monophosphate dehydrogenase (IMPDH). This drug has the ability to inhibit T- and B-cell proliferation through the de novo pathway for synthesis of guanosine nucleotides. Mycophenolic acid has antiproliferative activity in vitro against a variety of tumor-cell lines and in vivo against murine leukemias, lymphomas, and solid tumors. A serious concern is whether the increased power of immunosuppressive combinations administered to patients who have had organs transplanted has now led to an increased risk for tumor development.
Adriamycin is a hydroxy derivative of Daunorubicin, a commonly and widely used antitumor drug. In order to explore whether the mycophenolate mofetil and adriamycin have antiproliferative activity on hepatocellular carcinoma cells and possible clinical application in cancer therapy, we examined the anti-proliferation effects of mycophenolate mofetil with adriamycin on hepatocellular carcinoma cells in vitro.
HepG-2 cell line was provided by Experimental Facility Core of Tangdu Hospital, The Fourth Military Medical University, China.
We purchased RPMI-1640 from GIBCO (USA); calf serum (CS) (Sijiqing biological product company, Hangzhou, China); mycophenolate mofetil (MMF) from Shanghai Company; and Hoechst 33258 staining solution was purchased from Xi’an Company.
HepG-2 cells were cultured in RPMI-1640 medium (pH 7.2-7.3) supplemented with 10% inactivated fetal calf serum (FCS), 100 μg/mL penicillin and l00 μg/mL streptomycin, and incubated in humid conditions under 5% CO2 at 37°C. Cells in the logarithmic growth phase were used for further experiments. We established 4 experimental groups as follows: MMF group (0.1-100 μg/mL), adriamycin (ADM) group (1 μg/mL), MMF (0.1-100 μg/mL) + ADM group (1 μg/mL), and control group (untreated).
HepG-2 cells in the logarithmic growth phase were collected, and 200 μL of cell suspension was dispensed at a density of 4 × 10⁶ cells per well in 96-well plates. We maintained 6 parallel wells for each group, and cultured the cells for 0, 24, 48, and 72 h. Finally, we added 20 μL of 3-[4,5-dimethylthiazol-2-yl]-2,5-diphenyl tetrazolium bromide (MTT) (5 mg/mL) to each well and incubated the plates for 4 h. Water-insoluble formazan crystals which formed were solubilized by adding 150 μL of dimethylsulfoxide (DMSO) to each well. We determined the absorbance (A-value) of the culture solutions at 570 nm (test wavelength) and 490 nm (reference wavelength) within 20 min (i.e. before the disappearance of the colored particles). The cell growth inhibition rate was calculated according to the formula: Cell growth inhibition rate = (A-value of control group - value of experimental group)/A-value of control group × 100%.
Cells were detached from the wells by digestion with 0.25% trypsin and then centrifuged. The cell pellets were washed twice with phosphate-buffered saline (PBS) and fixed with 70% cold alcohol for 24 h at 4°C. The solution was centrifuged again to remove alcohol. After washing with PBS, the cells were mixed with 200 μg/mL of RNase. The number of cells in each phase of the cell cycle was determined by flow cytometry (FCM). Data were processed by the MAC analytical system program.
We performed [3H]-thymidine uptake assays to evaluate the effect of MMF on cell growth. Briefly, cells treated with different drug concentrations were collected at various times. Then, 200 μL of cell suspension (1 × 10⁶ cells) was dispensed in each well of the 96-well culture plates. Next, [3H]-thymidine (1 μCi/well) was added and the cells were incubated for additional 6 h at 37°C. Cellular DNA was collected on a glass fiber filter by using an automatic cell collector. The glass fiber filter was dried at room temperature and placed in a thermal bag containing 10 mL of scintillation fluid. The Cpm was finally determined using β-scintillation counter.
After digestion with 0.25% trypsin, the cells treated with different drug concentrations were collected at various times, centrifuged (3000 rpm, 5 min), and dried. The cells were fixed with 40 g/L formaldehyde for 10 min, washed twice with distilled water, and then dried at room temperature. The cells were stained with Hoechst 33258 (5 mg/L), and the morphological changes were observed under a fluorescence microscope (Ex360 nm/Em450 nm).
The 96-well-plate was first coated with 20 mg/L of fibronectin (FN) and incubated at 37°C for 1 h; subsequently, the plate was coated with 10 mg/L of FN (Sigma, USA) and incubated at 4°C overnight. A few wells were left uncoated and were used as negative controls. Further, the wells were washed twice with a washing buffer, blocked with a blocking buffer, and finally the plate was incubated at 37°C for 1 h. The plate was washed again with washing buffer and frozen on ice. Then, 50 μL of cells (4 × 10⁵/mL) were added to each well and the plates were incubated at 37°C for 30 min. Subsequently, the plate was shaken, washed, and fixed with 4% paraformaldehyde at room temperature (RT) for 10-15 min. Finally, the plate was stained with crystal violet for 10 min, washed, dried completely, and incubated at RT for 30 min after the addition of 2% sodium dodecyl sulfate (SDS). The plate was read using a microplate reader at 550 μm. The ratio of inhibition of cell adhesion was calculated as follows: inhibition ratio = [(A-value of experimental group/A-value of BSA) - 1] × 100.
The total RNA was extracted from cells using the RNase Mini kit (Qiagen, Valencia, CA, USA). The extracted RNA samples were analyzed by measuring the absorbance at 260 nm using a Genequant spectrophotometer (Amersham Biosciences, Piscataway, NJ, USA). Next, 1 μg of total RNA was added to a solution containing 0.5 μg/μL oligo dT, 10 mmol/L dNTP (Promega), and diethylpyrocarbonate (DEPC)-treated water (total volume: 13 μL), and this mixture was then incubated for 5 min at 65°C. Next, we prepared a mixture for reverse transcription, which included 4 μL of 5 × first-strand buffer (Promega), 1 μL of 0.1 mol/L dithiothreitol (DTT) (Promega), 1 μL of 40 U/μL RNasin (Promega), and 1 μL of 200 U/μL Superscript III (Invitrogen). After mixing, the samples were incubated at 37°C for 45 min, 95°C for 5 min, and 4°C for 5 min. Then, 2 μL of cDNA (reverse transcription product) was added to 48 μL of polymerase chain reaction (PCR) mixture containing 10 μmol/L primers for Bcl-2, intercellular adhesion molecule-1 (ICAM-1), vascular cell adhesion molecule-1 (VCAM-1), and glyceraldehyde-3-phosphate dehydrogenase (GAPDH) (Invitrogen); 10 mmol/L dNTP (Promega); 10 × PCR buffer (Promega); 25 mmol/L MgCl2 (Promega); 5 U/μL Go Taq (Promega); and DEPC-treated water. The primer sequences, length of the amplified product, and annealing temperature were as follows. For Bcl-2: forward primer, 5′-GACTGAATCGGAGATGGAGACC-3'; backward primer, 5′-CGATCCGACTCACCAATACC-3'; length of the amplified product, 380 bp; and annealing temperature, 57°C. For ICAM-1: forward primer, 5′-AGCCAATTTCTCGTGCCG-3′; backward primer, 5′-AGGAGTCGTTGCCATAGGTG-3'; length of the amplified product, 267 bp; and annealing temperature, 58°C. For VCAM-1: forward primer, 5′-TGGGAATCTACAGCACCT-3′; backward primer, 5'-AATGGTAGGGATGAAGGTC-3′; length of the amplified product, 355 bp; and annealing temperature, 50°C. For GAPDH (internal control): forward primer, 5′-CACCCACTCCTCTACCTTCGA-3′; backward primer, 5′-TCGTCCTCCTCTGGTGCTCT-3′; and length of the amplified product, 76 bp. The PCR products were subjected to 2% agarose gel electrophoresis and visualized using ethidium bromide (EtBr) staining. The densitometric data of PCR products was processed using the Gel-Pro Analyzer Software. The relative transcript abundance was expressed as the ratio of the target transcript level to the level of GAPDH transcripts in terms of percentage.
All experiments were performed in triplicate and the results were expressed as mean ± SD. Statistical analysis was performed using Student’s t-test with the SAS 6.12 software. The data was statistically significant if P < 0.05.
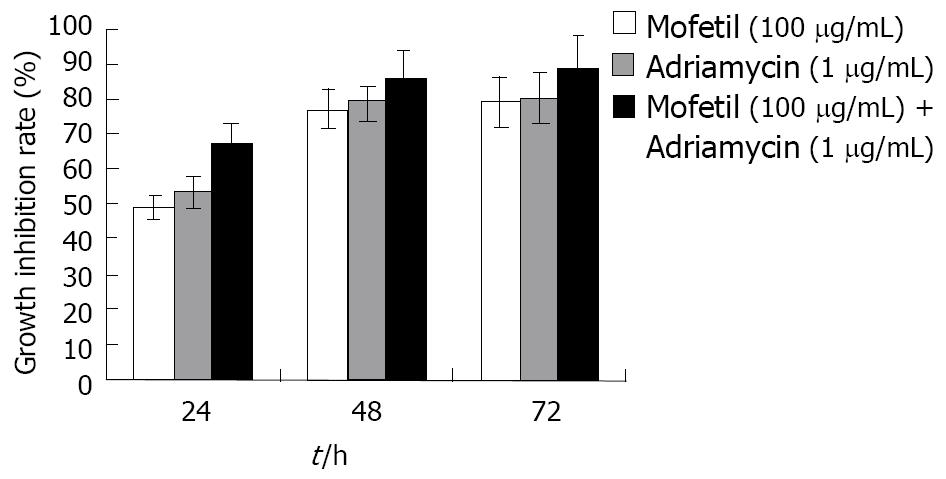
As shown in Figure 1, treatment with MMF, ADM, and MMF + ADM inhibited the growth of HepG-2 cells in a dose- and time-dependent manner (all P < 0.05).
In MMF 100 μg/mL group, as treatment time increased, the cell percentage at G0-G1 phase was increased and that at S phase was decreased while no obvious effect was found at G2-M phase. In addition, apoptosis rate of HCC cells was significantly higher in treatment group than control group. In, similar results was also obtained in ADM 1 μg/mL group, except that the cell percentage at G2-M phase was increased, but not unchanged. In MMF + ADM group, cell percentage at G0-G1 phase or at G2-M phase significantly increased and that at S phase significantly decreased. The apoptosis rate was dramatically increased in a time-dependent manner (P < 0.05) (Table 1).
| Group | n | G0/G1 (%) | S (%) | G2/M (%) | Apoptosis (%) |
| Control group | 3 | 32.07 ± 1.32 | 66.20 ± 1.26 | 1.73 ± 0.62 | 2.86 ± 0.03 |
| MMF | 3 | 68.22 ± 1.37 | 27.98 ± 0.63 | 3.80 ± 1.03 | 13.34 ± 0.31 |
| ADM | 3 | 70.52 ± 2.52 | 17.53 ± 0.78 | 11.90 ± 0.51 | 21.56 ± 0.56 |
| MMF + ADM | 3 | 73.36 ± 2.73 | 12.15 ± 0.59 | 14.13 ± 0.38 | 28.33 ± 0.76 |
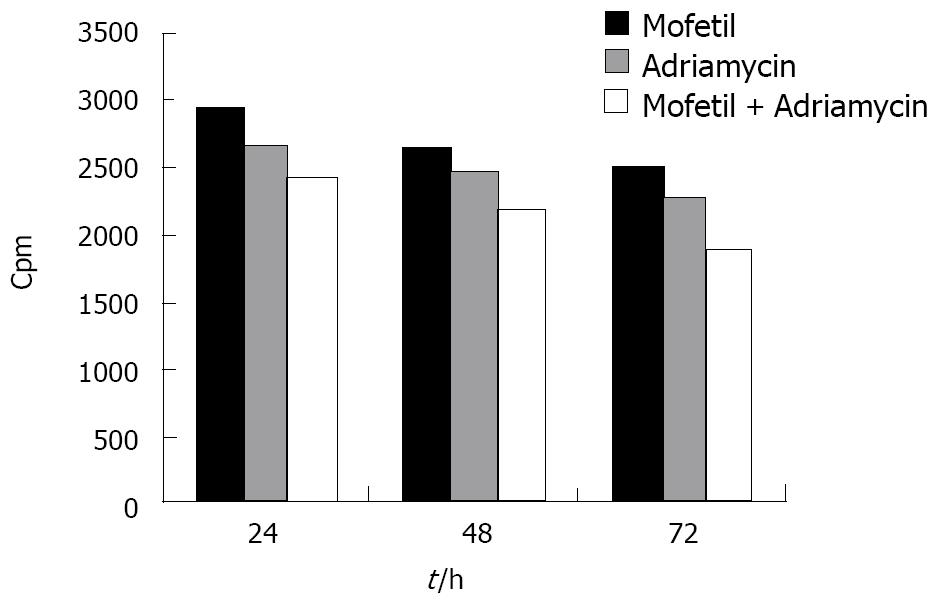
As shown in Figure 2, the proliferation of HCC cells in the MMF + ADM group was significantly inhibited within 72 h after treatment with a cpm value of 1892.23 ± 142 (mean ± SD), suggesting that the combination of MMF and ADM exerted a profound inhibitory effect on the proliferation of HepG-2 cells (P < 0.01).
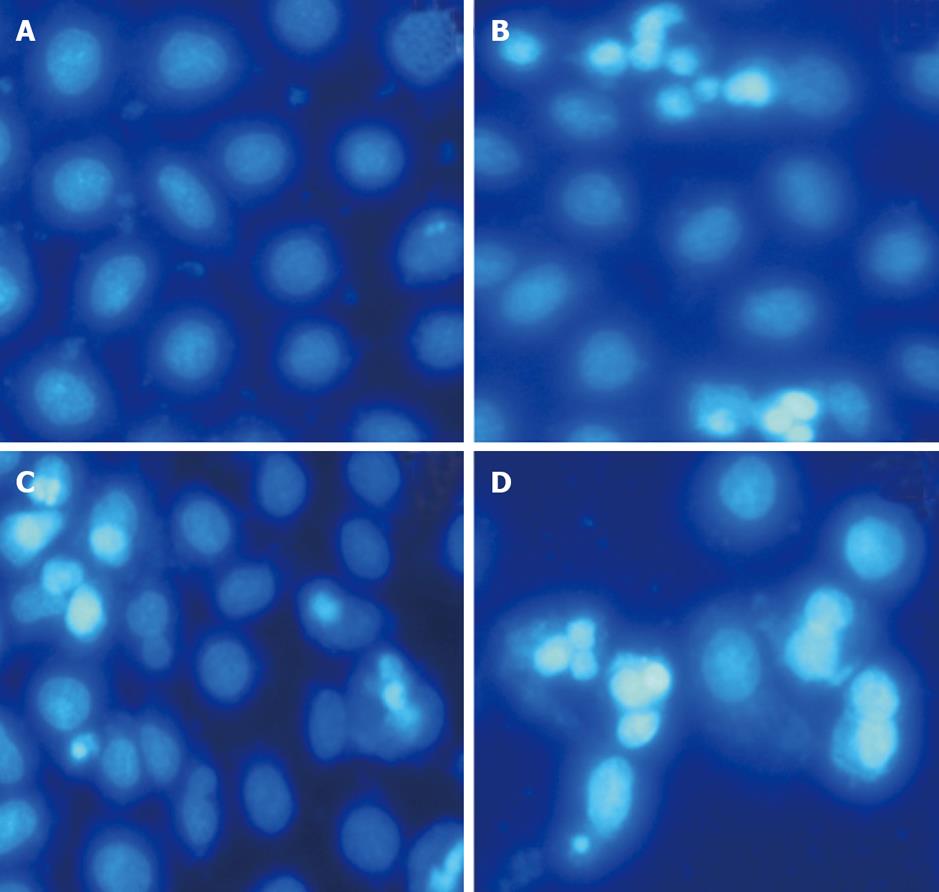
Treatment of apoptotic HepG-2 cells with different drugs for 24, 48, and 72 h revealed obvious morphological changes such as condensation of chromatin and nuclear fragmentations on Hoechst 33258 staining (Figure 3). In addition, after 48 h of treatment, the number of apoptotic cells in MMF + ADM group gradually increased relative to those in the other 2 groups.
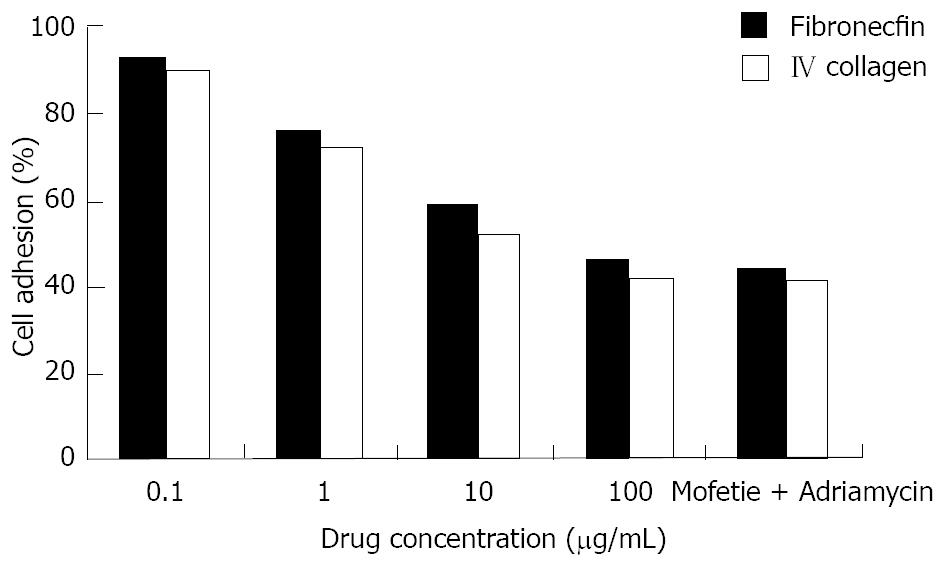
HepG-2 cells in logarithmic growth phase were treated with different drugs at different concentrations for 48 h. We found that the capacity for cell adhesion decreased significantly in a dose-dependent manner as shown in Figure 4 (P < 0.05 Figure 4).
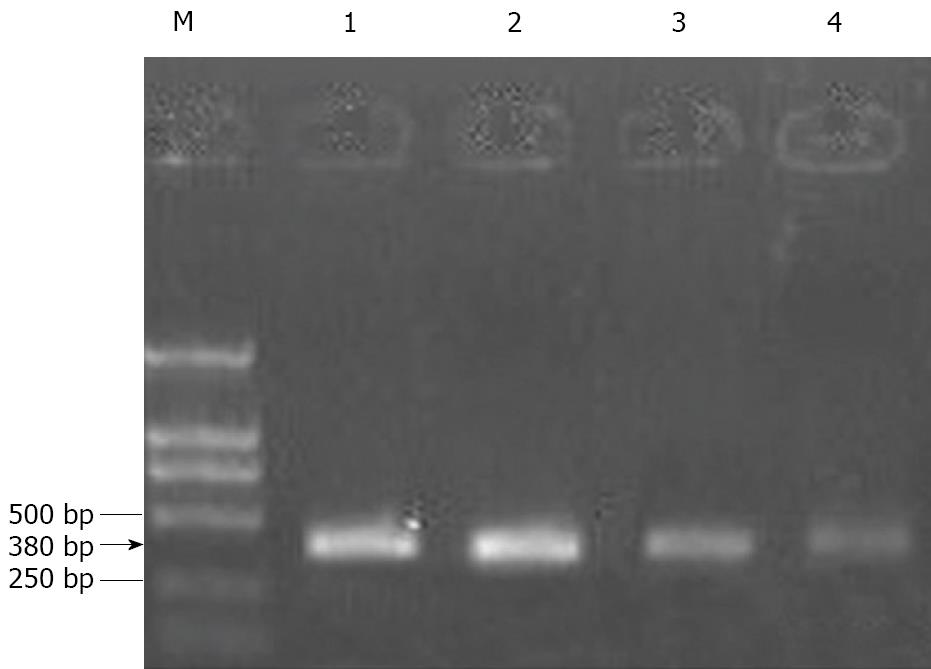
After treating HepG-2 cells with MMF or ADM for 72 h, the ratios of Bcl-2 gene expression of the experimental group and the control group were 0.61 ± 0.06 and 0.56 ± 0.05, respectively. Further, the ratio in MMF + ADM group was 0.38 ± 0.10, which was reduced by 32.14% as compared to the ratio in the ADM group (P < 0.01; Figure 5).
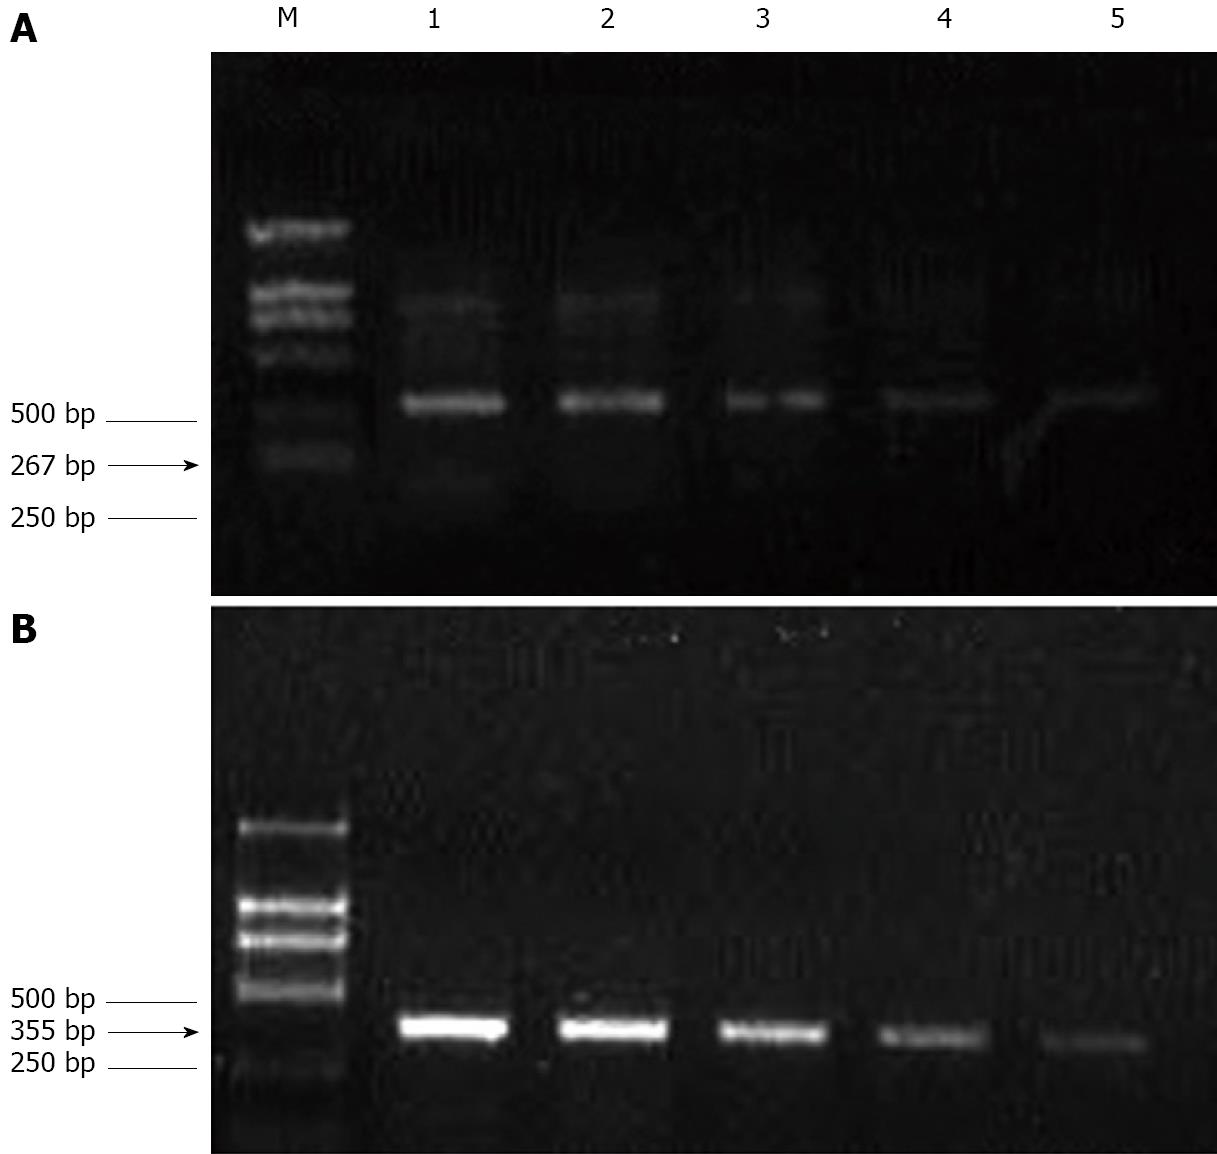
When the drug concentration was 100μg/mL, the ICAM-1/VCAM-1 expression ratio in the experimental group and control group was 0.42 ± 0.05 and 0.51 ± 0.03, respectively. The ICAM-1 and VCAM-1 gene expression was lowered in a dose-dependent manner (P < 0.01; Figure 6).
The outcomes of liver transplantation have shown improvement in recent years. Cherqui[1] and other researchers have reported that the survival rates of non-cancer patients and those of patients with small tumors (> 5 cm in diameter) after transplantation are almost identical(1-3 years). Annually, liver transplantation is performed on approximately 4 00 patients across China, among which 30%-40% are referred for liver transplantation of HCC. Tumor recurrence is one of the chief concerns after liver transplantation. Even though the pathological liver and the primary site of HCC are removed during liver transplantation, tumor recurrence and metastasis may occur. In 1999, Bismuth reported that the liver cancer recurrence rate was as high as 22% even after selecting optimal liver transplantation. The average life span of patients after tumor recurrence was only 15.3 mo which was significantly shorter than the life span of patients who underwent liver resection (31.6 mo). The selection of immunosuppressive drugs is one of the main factors influencing liver cancer recurrence. Theoretically, long-term use of immunosuppressive drugs potentially inhibits the immune response and natural defense, thereby contributing to tumor recurrence and growth[2,3]. However, recent reports suggest that not all immunosuppressants promote tumor growth, and in fact, a few might also exhibit anti-tumor properties.
Many immunosuppressive drugs used in clinical therapy, such as rapamycin[4,5] have been proved to possess anti-tumor effects[4]. As early as 1994, Tressler RJ[6] found that MMF possessed anti-rejection effect as well as anti-tumor effect, and MMF could inhibit the growth of Kaposi’s sarcoma[7]. In addition, Tobias[8] found that MMF exerted different anti-tumor effects on HT-29 colon cancer cells and DU-145 prostate cancer cells. Liu C[9] found that MMF exerted an inhibitory effect on the proliferation of epithelial cells of the intrahepatic bile duct. However, the effect was not statistically significant, thereby suggesting that the drug exerted a stronger effect on tumor cells than on normal cells. Moreover, MMF exerted a mild toxic effect on the liver, kidneys, and bone marrow; further, MMF treatment lowered the probability of acquiring an infection. Meanwhile, fewer incidences of tumor induction have been reported in patients treated with MMF as compared to those in patients treated with cyclosporine and FK506.
ADM, which is a glucoside antibiotic, is commonly used for antitumor treatment and plays an important role in chemotherapy. It can cause necrosis by direct killing of cells or induce apoptosis mainly by affecting topoisomerase II activity. Further, ADM induces nucleopore changes in the peripheral sensory ganglion cells. However, ADM treatment exerts serious clinical adverse effects such as inhibition of bone marrow, depletion of white blood cells and platelets, toxic effects on cardiac muscles, and damage to liver and kidney. Although ADM is recommended as a chemotherapeutic drug for liver cancer, its clinical efficacy is not satisfactory due to a partial remission rate of only 16%[10,11].
To improve the efficiency of controlling tumor recurrence after liver transplantation, we evaluated the effects of MMF + ADM therapy in several in vitro experiments. The results of MTT assay revealed that monotherapy with ADM or MMF showed inhibition of cell growth, while MMF + ADM therapy afforded an inhibition rate of more than 90% with cell distribution in G1 and G2/M phase greater than that in S phase.
The Bcl-2 gene (B-cell lymphoma/leukemia-2 gene) is a proto-oncogene that inhibits cellular apoptosis. Bcl-2 exerts marked effects on the mitochondrial and pore complex signal molecules, thereby contributing to the control of signal transduction and prolonged cell life[12]. We found that MMF + ADM treatment markedly downregulated Bcl-2 expression.
The findings of our study suggest that MMF and ADM inhibit the growth of HCC cells and promote cellular apoptosis. These findings can help in the development of new modalities of chemotherapy and help prevent immunological rejection after liver transplantation. However, we need to conduct experiments with a greater number of animals and determine the optimal strategy for treatment of liver cancer patients after liver transplantation.
Hepatocellular carcinoma (HCC) has become increasingly important all over the world. Liver transplantation is an effective method nowadays in the treatment of HCC. Patients who receive chronic immunosuppression following organ allotransplantation display an increased incidence of de novo neoplasms. So, it becomes a challenge to find a proper drug. Recently, some researchers reported that mycophenolic acid had antiproliferative activity against a variety of tumor cell lines in vitro and against murine leukemias, lymphomas, and solid tumors in vivo. Adriamycin (ADM) is a chemotherapeutic agent used widely in treatment of malignant tumors. Combined use of mycophenolate mofetil (MMF) and ADM may exert remarkable effect.
Liver transplantation and the application of the immunosuppression are hotspots in the research field related to this article.
In this study, we have educed that MMF can inhibit HepG-2 cell growth, adhesion, and induce its apoptosis in a concentration-dependent manner. We also found combination of MMF and ADM exerted remarkable inhibitory effects on the growth of HCC cells.
MMF is an immunosuppressive agent, which has been used in organ allotransplantation area. ADM is a chemotherapeutic agent used widely in the treatment of malignant tumors. If MMF plus ADM is used after liver transplantion, a double action of anti-immunological rejection and anti-tumor may be achieved.
The authors present interesting results on the combined effects of MMF and ADM on HepG2 cell lines. The findings indicate that MMF does indeed has some effects on some specific genes on HepG2 cells. Overall, this is a great study clearly presented. Maybe in the future, the authors should repeat the study on at least three different human HCC cell lines to document the broader applicability of their findings. Anyway, it should be accepted for publication.
Peer reviewers: Ali Sazci, MSc, PhD, Professor, Kocaeli University, Faculty of Medicine, Department of Medical Biology and Genetics, Umuttepe, 41380 Kocaeli, Turkey; George Michalopoulos, MD, PhD, Professor, Department of Pathology, University of Pittsburgh, School of Medicine, S-410 Biomedical Science Tower, Pittsburgh, PA 15261, United States
| 1. | Cherqui D. Role of adjuvant treatment in liver transplantation for advanced hepatocellular carcinoma. J Hepatobiliary Pancreat Surg. 1998;5:35-40. [Cited in This Article: ] |
| 2. | Guba M, Graeb C, Jauch KW, Geissler EK. Pro- and anti-cancer effects of immunosuppressive agents used in organ transplantation. Transplantation. 2004;77:1777-1782. [Cited in This Article: ] |
| 3. | Vivarelli M, Bellusci R, Cucchetti A, Cavrini G, De Ruvo N, Aden AA, La Barba G, Brillanti S, Cavallari A. Low recurrence rate of hepatocellular carcinoma after liver transplantation: better patient selection or lower immunosuppression? Transplantation. 2002;74:1746-1751. [Cited in This Article: ] |
| 4. | Joerger M, Schellens JH, Beijnen JH. Therapeutic drug monitoring of non-anticancer drugs in cancer patients. Methods Find Exp Clin Pharmacol. 2004;26:531-545. [Cited in This Article: ] |
| 5. | Zhang JF, Liu JJ, Lu MQ, Cai CJ, Yang Y, Li H, Xu C, Chen GH. Rapamycin inhibits cell growth by induction of apoptosis on hepatocellular carcinoma cells in vitro. Transpl Immunol. 2007;17:162-168. [Cited in This Article: ] |
| 6. | Tressler RJ, Garvin LJ, Slate DL. Anti-tumor activity of mycophenolate mofetil against human and mouse tumors in vivo. Int J Cancer. 1994;57:568-573. [Cited in This Article: ] |
| 7. | Hussein MM, Mooij JM, Roujouleh HM. Regression of post-transplant Kaposi sarcoma after discontinuing cyclosporin and giving mycophenolate mofetil instead. Nephrol Dial Transplant. 2000;15:1103-1104. [Cited in This Article: ] |
| 8. | Engl T, Makarević J, Relja B, Natsheh I, Müller I, Beecken WD, Jonas D, Blaheta RA. Mycophenolate mofetil modulates adhesion receptors of the beta1 integrin family on tumor cells: impact on tumor recurrence and malignancy. BMC Cancer. 2005;5:4. [Cited in This Article: ] |
| 9. | Liu C, Schreiter T, Frilling A, Dahmen U, Broelsch CE, Gerken G, Treichel U. Cyclosporine A, FK-506, 40-0-[2-hydroxyethyl]rapamycin and mycophenolate mofetil inhibit proliferation of human intrahepatic biliary epithelial cells in vitro. World J Gastroenterol. 2005;11:7602-7605. [Cited in This Article: ] |
| 10. | Roland T, Skeel MD. Chemotherapy Manual of Cancer. Beijing: Science Publishing House; 2002; . [Cited in This Article: ] |
| 11. | Chen XQ, Jin YY. Materia Medica. 14th ed. Beijing: The People’s Medical Publishing House; 1998; . [Cited in This Article: ] |


