Published online Feb 28, 2020. doi: 10.3748/wjg.v26.i8.804
Peer-review started: November 26, 2019
First decision: December 30, 2019
Revised: January 4, 2020
Accepted: January 11, 2020
Article in press: January 11, 2020
Published online: February 28, 2020
Liver cancer has a high mortality and morbidity rate throughout the world. In clinical practice, the prognosis of liver cancer patients is poor, and the complex reasons contribute to treatment failures, including fibrosis, hepatitis viral infection, drug resistance and metastasis. Thus, screening novel prognostic biomarkers is of great importance for guiding liver cancer therapy. Orosomucoid genes (ORMs) encode acute phase plasma proteins, including orosomucoid 1 (ORM1) and ORM2. Previous studies showed their upregulation upon inflammation, but the specific function of ORMs has not yet been determined, especially in the development of liver cancer.
To determine the expression of ORMs and their potential function in liver cancer.
Analysis of the expression of ORMs in different human tissues was performed on data from the HPA RNA-seq normal tissues project. The expression ratio of ORMs was determined using the HCCDB database, including the ratio between liver cancer and other cancers, normal liver and other normal tissues, liver cancer and adjacent normal liver tissues. Analysis of ORM expression in different cancer types was performed using The Cancer Genome Atlas and TIMER database. The expression of ORMs in liver tumor tissues and adjacent normal tissues were further confirmed using Gene Expression Omnibus data, including GSE36376 and GSE14520. The 10-year overall survival (OS), progression-free survival (PFS) and relapse-free survival (RFS) rates between high and low ORM expression groups in liver cancer patients were determined using the Kaplan-Meier plotter tool. Gene Set Enrichment Analysis (GSEA) was employed to explore the ORM2-associated signaling network. Correlations between ORM2 expression and tumor purity or the infiltration level of macrophages in liver tumor tissues were determined using the TIMER database. The correlation between ORM2 gene levels, tumor-associated macrophage (TAM) markers (including CD68 and TGFβ1) and T cell immunosuppression (including CTLA4 and PD-1) in liver tumor tissues and liver GTEx was determined using the GEPIA database.
ORM1 and ORM2 were highly expressed in normal liver and liver tumor tissues. ORM1 and ORM2 expression was significantly decreased in liver tumor tissues compared with adjacent normal tissues, and similar results were also noted in cholangiocarcinoma, esophageal carcinoma, and lung squamous cell carcinoma. Further analysis of the Gene Expression Omnibus Database also confirmed the downregulation of ORM1 and ORM2 in liver tumors. Survival analysis showed that the high ORM2 group had better survival rates in OS, PFS and RFS. ORM1 only represented better performance in PFS, but not in OS or RFS. GSEA analysis of ORM2 from The Cancer Genome Atlas liver cancer data identified that ORM2 positively associated with the G2/M checkpoint, E2F target signaling, as well as Wnt/β-catenin and Hedgehog signaling. Moreover, apoptosis, IFN-α responses, IFN-γ responses and humoral immune responses were upregulated in the ORM2 high group. ORM2 expression was negatively correlated with the macrophage infiltration level, CD68, TGFβ1, CTLA4 and PD-1 levels.
The results showed that ORM1 and ORM2 were highly expressed specifically in liver tissues, whereas ORM1 and ORM2 were downregulated in liver tumor tissues. ORM2 is a better prognostic factor for liver cancer. Furthermore, ORM2 is closely associated with cancer-promoting pathways.
Core tip: These studies revealed that ORM genes are specifically expressed in the liver and downregulated in liver tumors. Orosomucoid 2 could be a prognostic factor, and is closely associated with tumor promoter signaling and a immunosuppressive network in liver cancer.
- Citation: Zhu HZ, Zhou WJ, Wan YF, Ge K, Lu J, Jia CK. Downregulation of orosomucoid 2 acts as a prognostic factor associated with cancer-promoting pathways in liver cancer. World J Gastroenterol 2020; 26(8): 804-817
- URL: https://www.wjgnet.com/1007-9327/full/v26/i8/804.htm
- DOI: https://dx.doi.org/10.3748/wjg.v26.i8.804
Liver cancer contributed the 5th highest mortality of cancer-related deaths, with an even higher morbidity rate, especially in Asia. The previous study showed that the hepatitis viral infection, including hepatitis B virus and hepatitis C virus, was a main reason for the high incidence of liver cancer in Asia. Current treatments of liver cancer include both curative and palliative approaches. In clinical practice, for those patients with early stage cancer, ablation, resection, transplant and ablation could be considered as curative treatments. However, for patients with intermediate and advanced stages of cancer, interventional treatment and sorafenib target therapy could be applied as palliative treatments. Nevertheless, the prognostic performance of liver cancer patients was poor. The reasons were complex, and the poor diagnoses and prognostic evaluations were the most appreciable aspects. In the clinic, alpha-fetoprotein (AFP) as a diagnostic and prognostic biomarker performs an important role, however its sensitivity and specificity were unsatisfactory, and some physiological activities could affect the expression of AFP, such as pregnancy and chronic hepatitis. Thus, screening for novel and effective biomarkers of liver cancer is critical.
The orosomucoid (ORM) family contains two genes in human, ORM1 and ORM2. The ORMs family contains three isoforms, ORM1, ORM2 and ORM3, which were identified as acute-phase proteins in the inflammation response. Wan et al[1,2] reported that ORM expression was elevated in response to cognitive impairment, and alleviated inflammation injury in the ischemic stroke mouse model. A detailed study identified that ORM2, but not ORM1 or ORM3, was highly expressed in the brain tissues of a neuroinflammation mouse model. In addition, ORM2 performed as an anti-inflammatory factor to inhibit microglial activation[3]. Furthermore, as an acute-phase protein, ORM1 and ORM2 were also reported to be involved in the process of enzyme replacement therapy in Fabry disease patients[4]. Other studies of ORMs also focused on the regulation of sphingolipid synthesis in yeast[5,6]. Besides, as acute-phage genes, ORM genes were reported to encode for endoplasmic reticulum membrane proteins, which regulate lipid homeostasis[7]. Interestingly, as in the recent study, researchers reported that ORM1 and ORM2 take part in the pathogenesis of hepatitis B virus-associated acute liver failure[8]. Considering the importance of HBV in the occurrence and development of liver cancer, it is important to determine whether ORM1 and ORM2 function in liver cancer. According to our knowledge, it is unknown whether ORM1 and ORM2 are expressed in liver cancer, and whether they play a significant role in the development of liver cancer. In this study, we first identified highly expressed ORM1 and ORM2 specifically in the liver, as well as the downregulation of ORM1 and ORM2 in liver tumors. Further survival analysis showed that lower ORM2 levels predict poor prognosis, and, more interestingly, that enrichment analysis of ORM2 revealed that decreased ORM2 was closely associated with cancer-promoting signaling pathways and involved in the regulation of tumor immunity. We first identified the expression of ORM1 and ORM2 in liver cancer, and this study also showed the potential application of ORM2 as a prognostic factor for liver cancer patients. Furthermore, some cancer-promoting signaling pathways might serve as a potential mechanism that is mediated by ORM2 in liver cancer.
Expression analysis of ORMs in different human tissues was performed as part of the Human Protein Atlas (HPA) RNA-seq normal tissues project[9]. Gene expression was shown as Reads Per Kilobase per Million mapped reads (RPKM) according to the RNA-seq results, including adrenal, appendix, bone marrow, brain, colon, duodenum, endometrium, esophagus, fat, gall bladder, heart, kidney, liver, lung, lymph node, ovary, pancreas, placenta, prostate, salivary gland, skin, small intestine, spleen, stomach, testis, thyroid and urinary bladder.
HCCDB is an integrative molecular database of hepatocellular carcinoma[10], and the ORM expression ratio was determined between liver tumors and adjacent normal tissues, liver tumor and other tumor tissues, normal liver and other normal tissues, liver tumors and other adjacent normal tissues. In addition, expression ratios were represented as fold change (FC) with log normalization.
Differential ORM gene expression between tumor and normal tissues of pan-cancer were conducted in the Diff Exp module of TIMER[11]. The sample data of different cancer types were obtained from the TCGA database. Gene expression levels were shown as RSEM with log2 normalization[12]. The correlation between ORM2 expression levels and tumor cell purity in the tumor tissues, as well as macrophage cell infiltration levels, were analyzed using the TIMER portal, and correlation analysis was conducted using the Pearson method.
Differential levels of ORM1 and ORM2 in liver tumor and normal tissues were confirmed in GSE36376[13] and GSE14520[14,15] with the Gene Expression Omnibus (GEO) database. GSE36376 contained 193 cases of non-tumor liver and 240 cases of liver tumor tissues, and GSE14520 contained 220 cases of non-tumor liver and 225 cases of liver tumor tissues. GPL10558 Illumina Human HT-12 V4.0 expression beadchips were applied as a platform for GSE36376, and GPL571[HG-U133A_2] Affymetrix Human Genome U133A 2.0 Arrays and GPL3921[HT_HG-U133A] Affymetrix HT Human Genome U133A Arrays were used as platforms for the GSE14520 series. The GEO-2R portal[16] was used to evaluate the different ORM expression levels. Benjamini & Hochberg (false discovery rate, FDR) was applied to adjust to the P value. The data were also applied for log transformation.
TCGA liver cancer patients were included to study the prognostic value of ORM1 and ORM2. The Kaplan-Meier plotter tool[17] was used to conduct the analysis of overall survival (OS), progression-free survival (PFS) and relapse-free survival (RFS) between ORM high and low expression groups in liver cancer patients. High and low expression of ORMs patients were determined using the median ORM levels. The log-rank P value method[18] was used to evaluate statistical differences.
TCGA liver cancer data were included to study the potential mechanistic network of ORM2 in liver cancer. The median levels of ORM2 were used to distinguish the low and high groups. Then, human. All. V7.0 Symbols. gmt [Hallmarks] and c5. All. V7.0 Symbols. gmt [Gene ontology] were set as the gene set databases, respectively, and the number of permutations was set at 1000. The Gene Set Enrichment Analysis (GSEA) reports could also be subjected to leading edges analysis using the GSEA software module[19,20].
Correlation analysis of differential genes was achieved using the GEPIA portal[21]. The correlation coefficient was evaluated by the Pearson method, and the results were calculated by non-log scale and visualized by a log-scale axis. The included samples contained TCGA liver tumor and TCGA adjacent normal liver tissues, and GTEx liver tissues[22] were also included to analyze the gene correlations.
Data from this study were graphed using GraphPad Prism software. The GEO-2R portal was used to analyze the GEO series, and P values were adjusted using Benjamini & Hochberg (False discovery rate, FDR). The difference between the two groups was tested by Student’s t-test. Survival curve analysis was evaluated using the Kaplan-Meier plotter portal, and the log-rank P value was used to test significant difference.
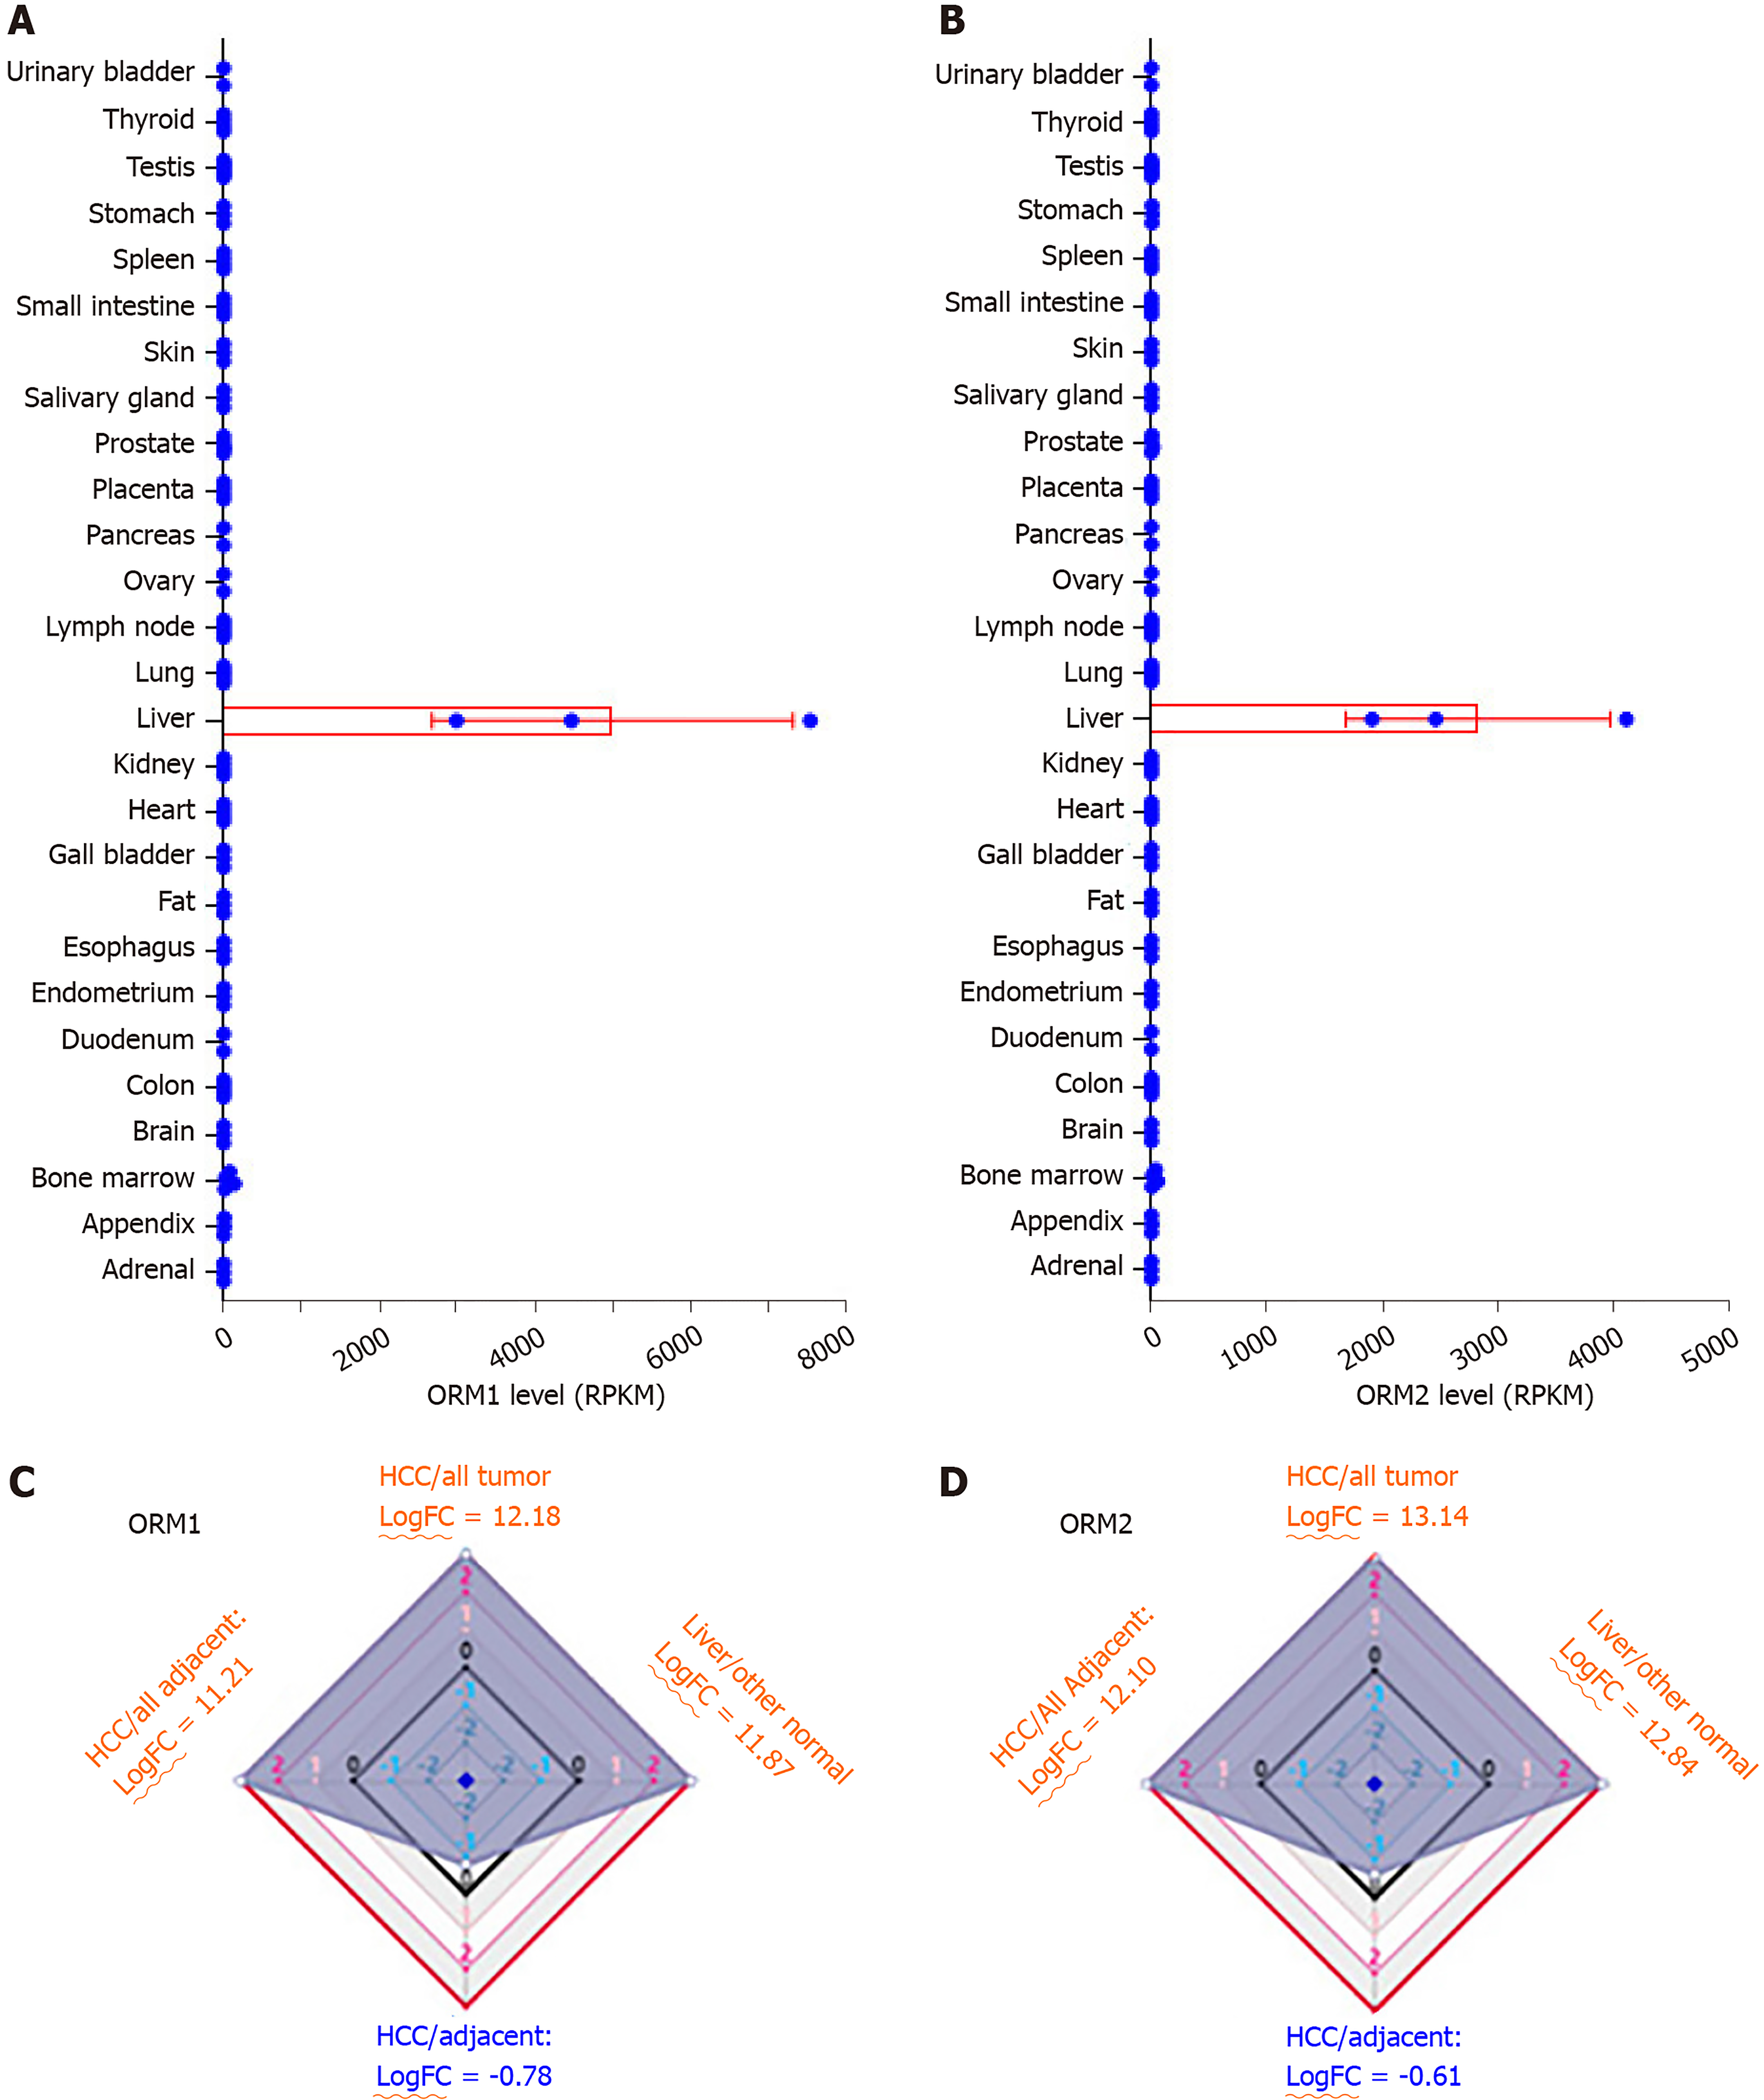
To evaluate the potential role of ORMs in the development of liver cancer, we first tested ORM expression in different human tissues by RNA-seq. As the results of Figure 1A and B show, ORM1 and ORM2 were significantly overexpressed in liver tissue, over 2000 times that of other tissues. To further evaluate the specific expression levels of ORMs in the liver, we further analyzed the differential ratios of ORM1 and ORM2 in liver tumors/adjacent liver tissues, liver tumors/other tumors, and adjacent liver tissues/other adjacent tissues. Results revealed that ORM1 and ORM2 were overexpressed in liver tumors compared with other tumor tissues. We further evaluated the expression ratios of adjacent liver tissues between others adjacent. From this aspect, we could conclude that ORMs were highly expressed in human tissues, suggesting that ORMs play important roles in liver function. More interestingly, ORM expression was downregulated in liver tumor tissues compared with adjacent liver tissues. Thus, we hypothesize that ORMs may serve as a potential regulatory mechanism in the occurrence and development of liver cancer.
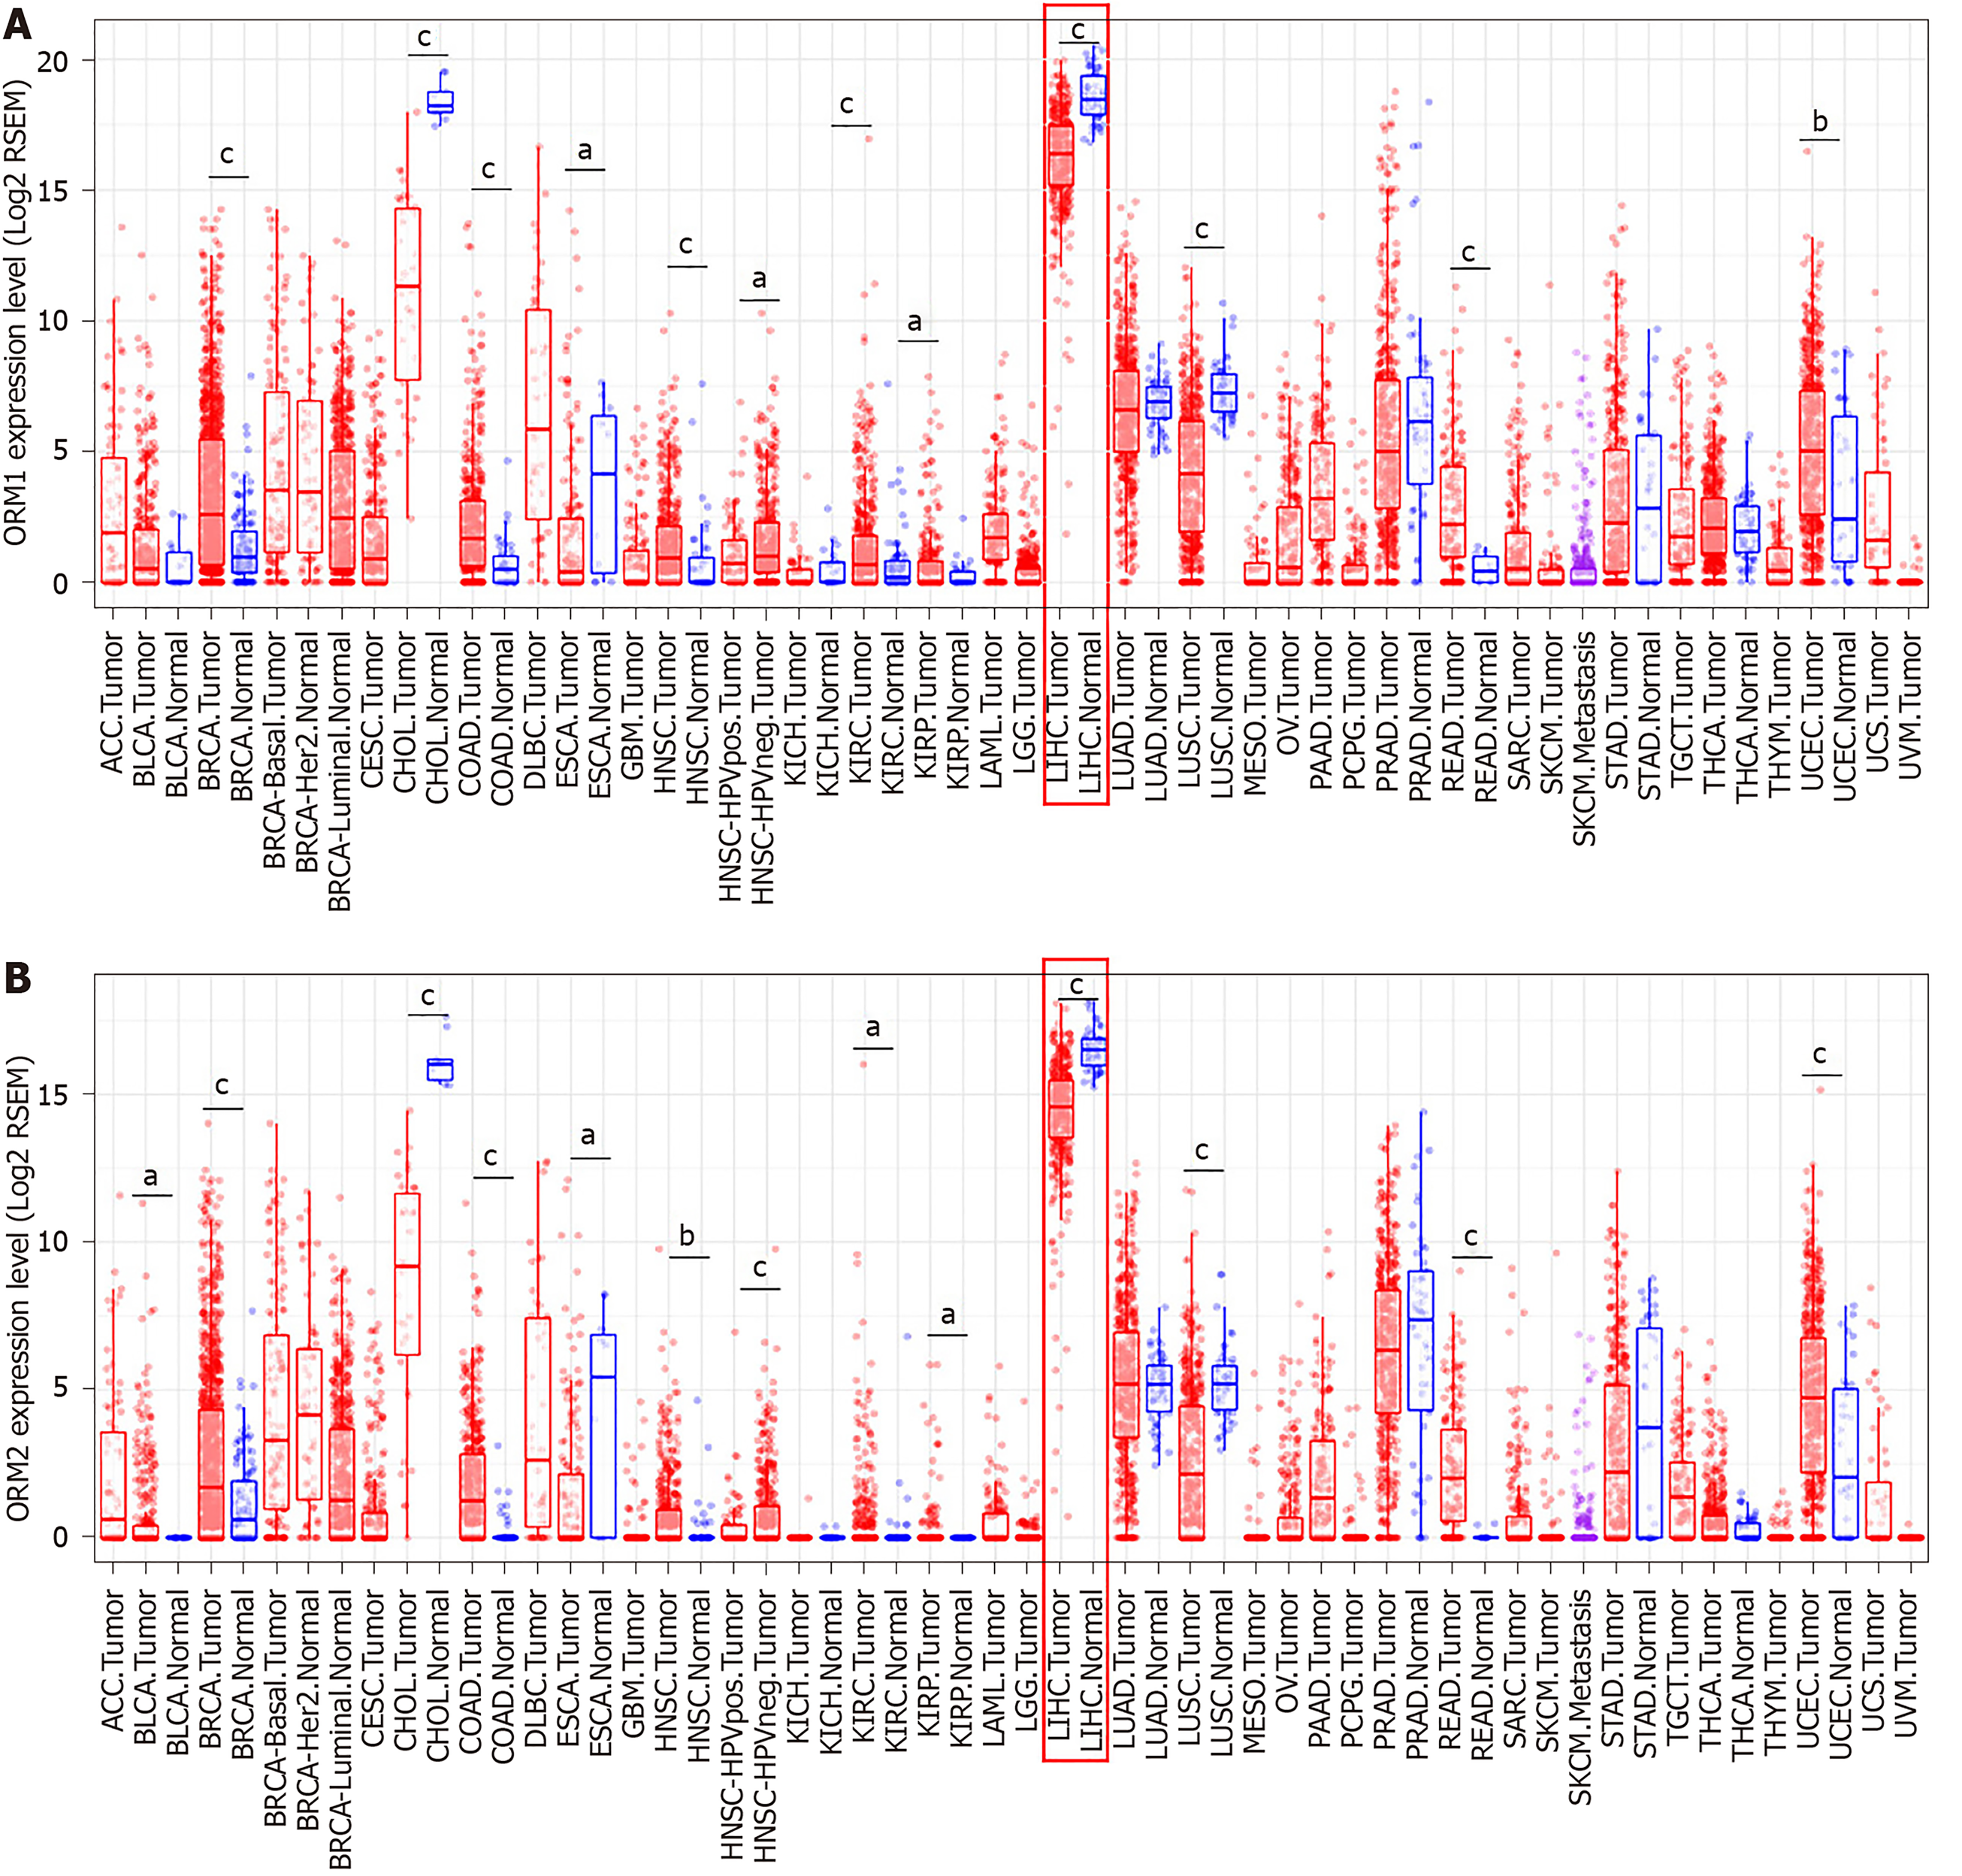
As mentioned above, ORM1 and ORM2 were highly expressed specifically in human liver tissues, and the differential expression ratio between liver tumors and adjacent normal tissues showed that ORM1 and ORM2 expression were decreased in tumor tissues. This led us to further explore the expression and potential role of ORM genes in cancer development. In this study, TCGA cancer databases including several cancer types were used to evaluate the expression of ORMs in tumor and adjacent normal tissues, respectively. As the results showed, ORM1 and ORM2 were both decreased in liver tumor tissues compared with adjacent normal tissues. A similar phenomenon was also observed in cholangiocarcinoma, esophageal carcinoma and lung squamous cell carcinoma. Meanwhile, ORM1 and ORM2 were overexpressed in breast invasive carcinoma, colon adenocarcinoma, head and neck squamous cell carcinoma, kidney renal clear cell carcinoma, kidney renal papillary cell carcinoma, rectum adenocarcinoma and uterine corpus endometrial carcinoma. Considering the low ORM expression levels in these tissues, and their overexpression in these cancer types, ORM genes may play different roles in different cancer types.
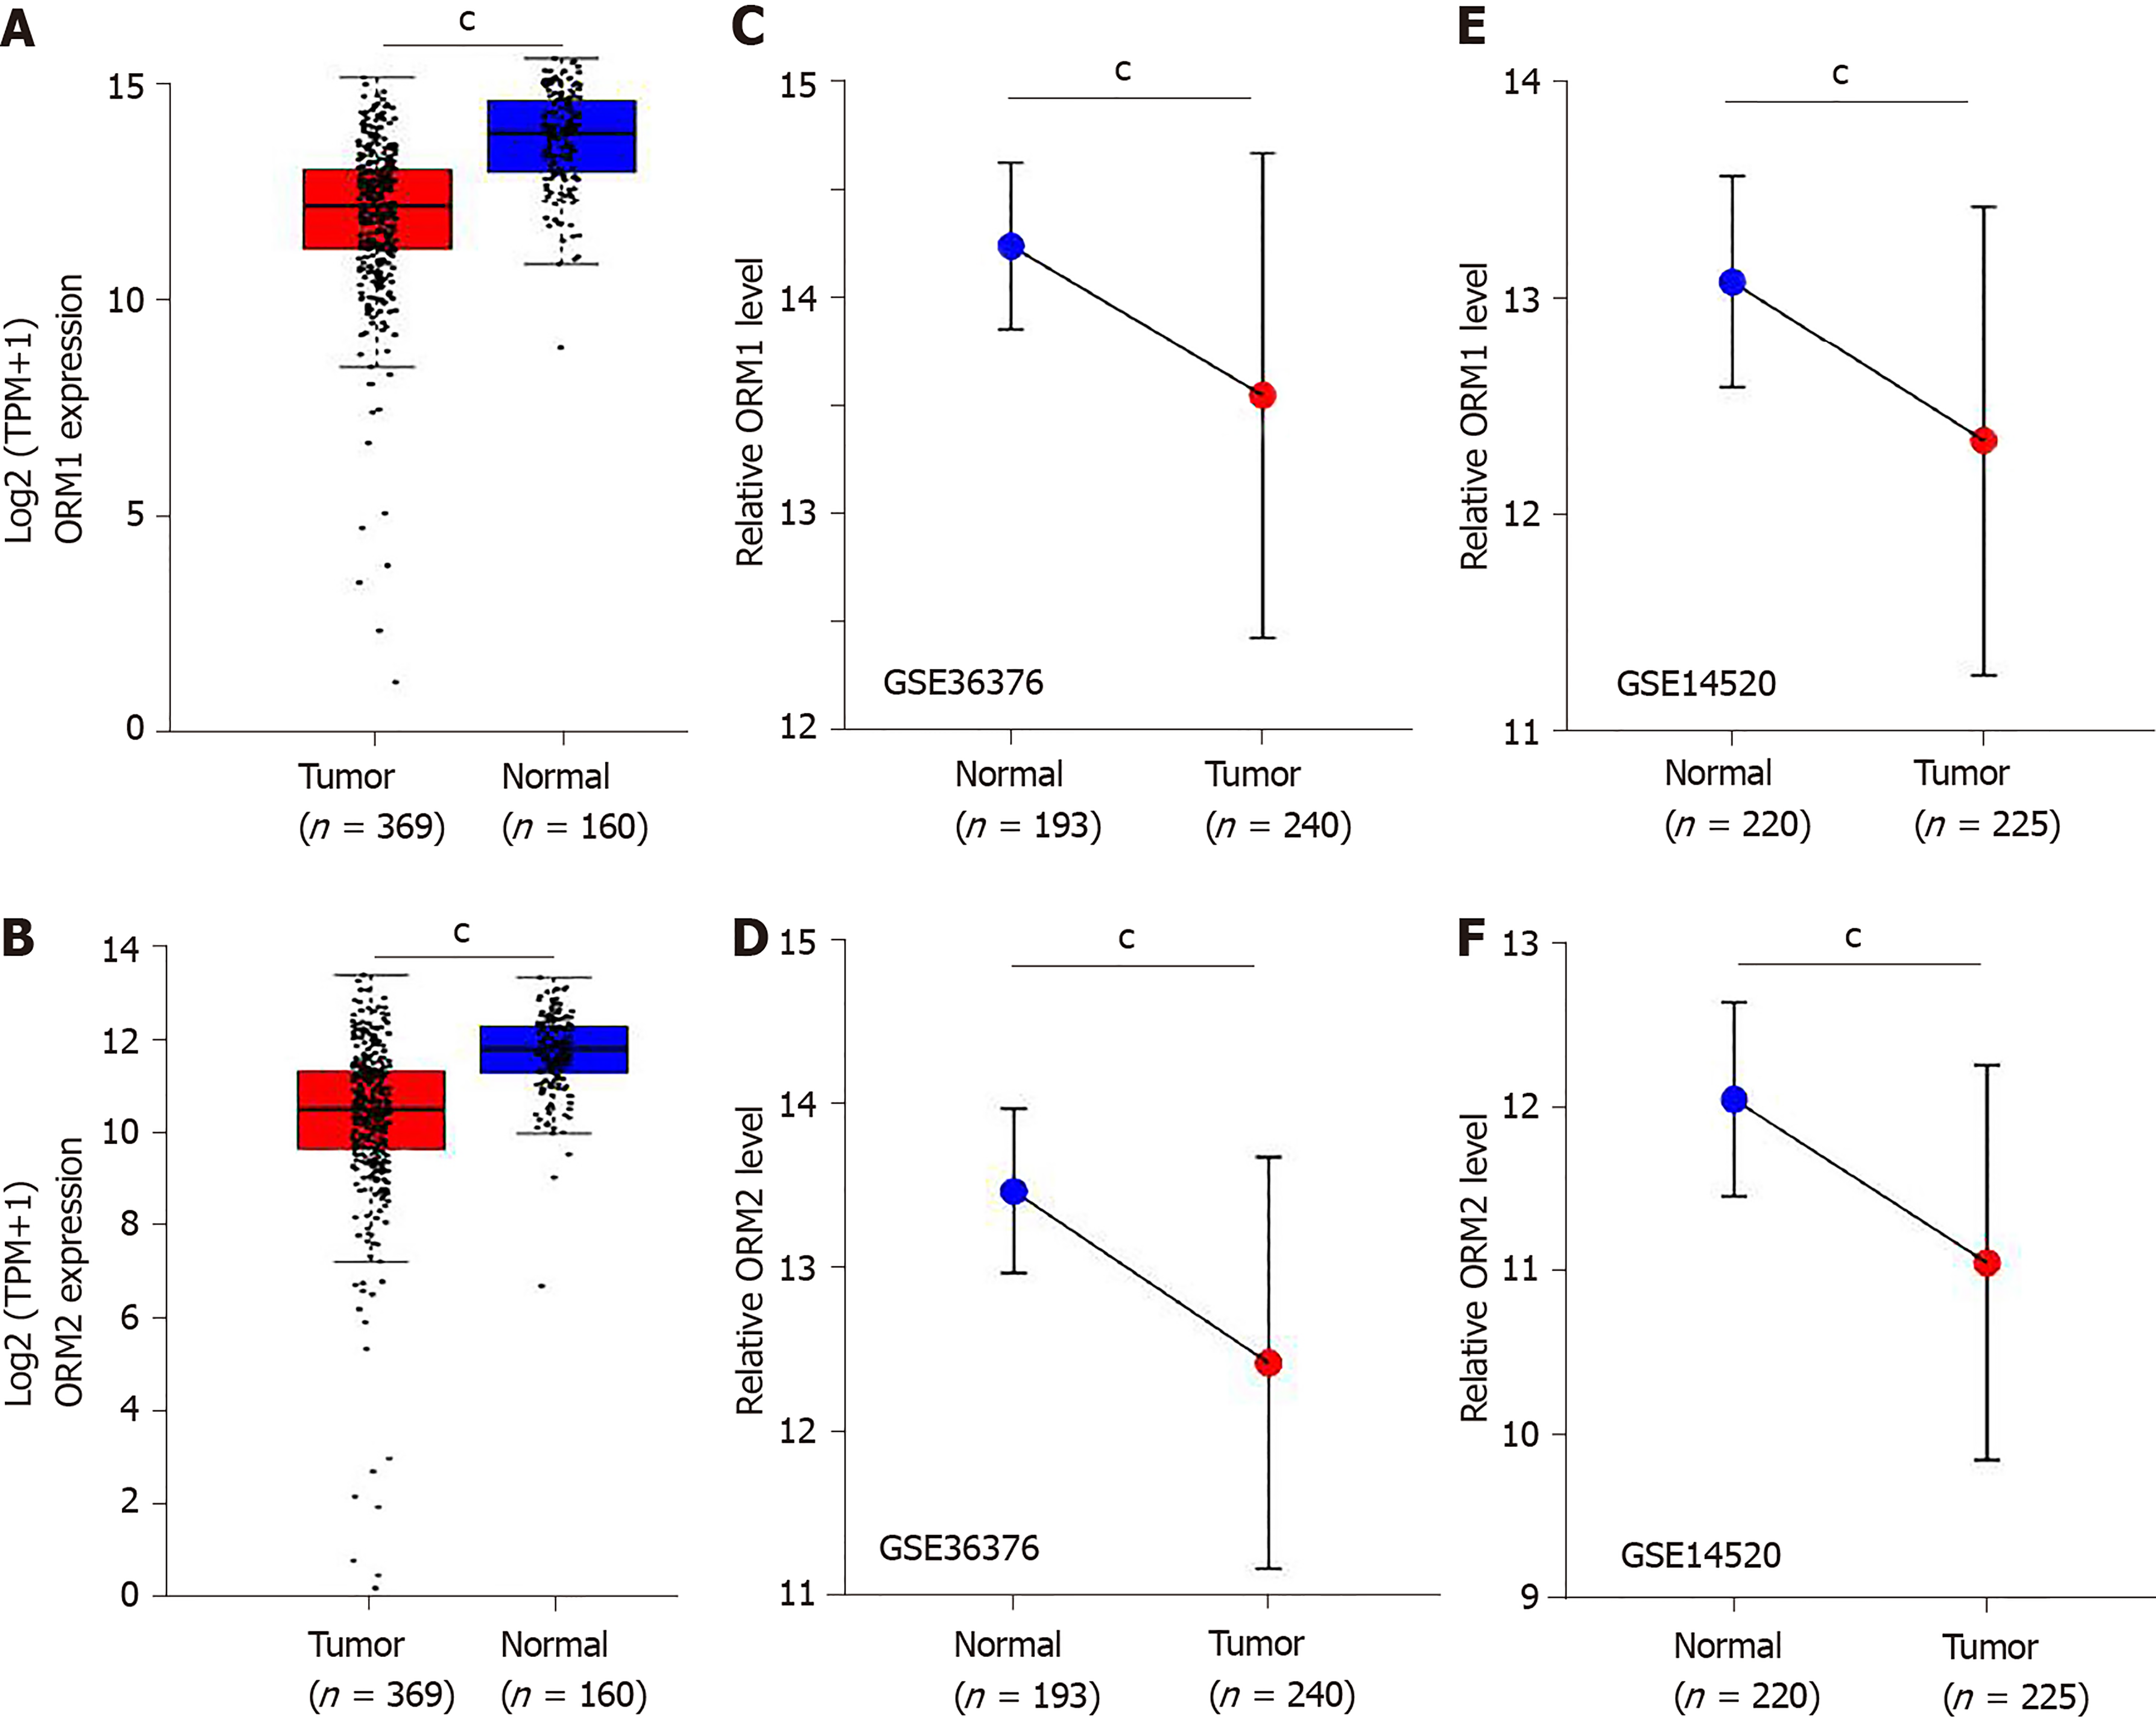
In this study, we identified that ORMs (including ORM1 and ORM2) were decreased in tumor tissues compared with adjacent normal liver tissues (Figure 1C and D, and Figure 2). To further verify the significant differential expression of ORMs in liver cancer, we further evaluated the expression of ORMs in liver tumors, adjacent normal tissues and GTEx liver tissues. The results showed that ORM1 and ORM2 expression were both lower in tumor tissues (Figure 3A and B). Moreover, microarray analysis of liver tumors and adjacent normal liver tissues was also performed to confirm the downregulation of ORMs in liver tumor tissues. Two series of GSE36376 and GSE14520 both showed that ORM1 and ORM2 were lowly expressed in liver tumor tissues (Figure 3C-F). From these results, we could conclude that ORM genes (including ORM1 and ORM2) were downregulated in liver tumors, and that ORMs were highly expressed specifically in normal liver tissues compared with other organ tissues. This suggests that ORMs might function as an important regulator in the occurrence and development of liver cancer.
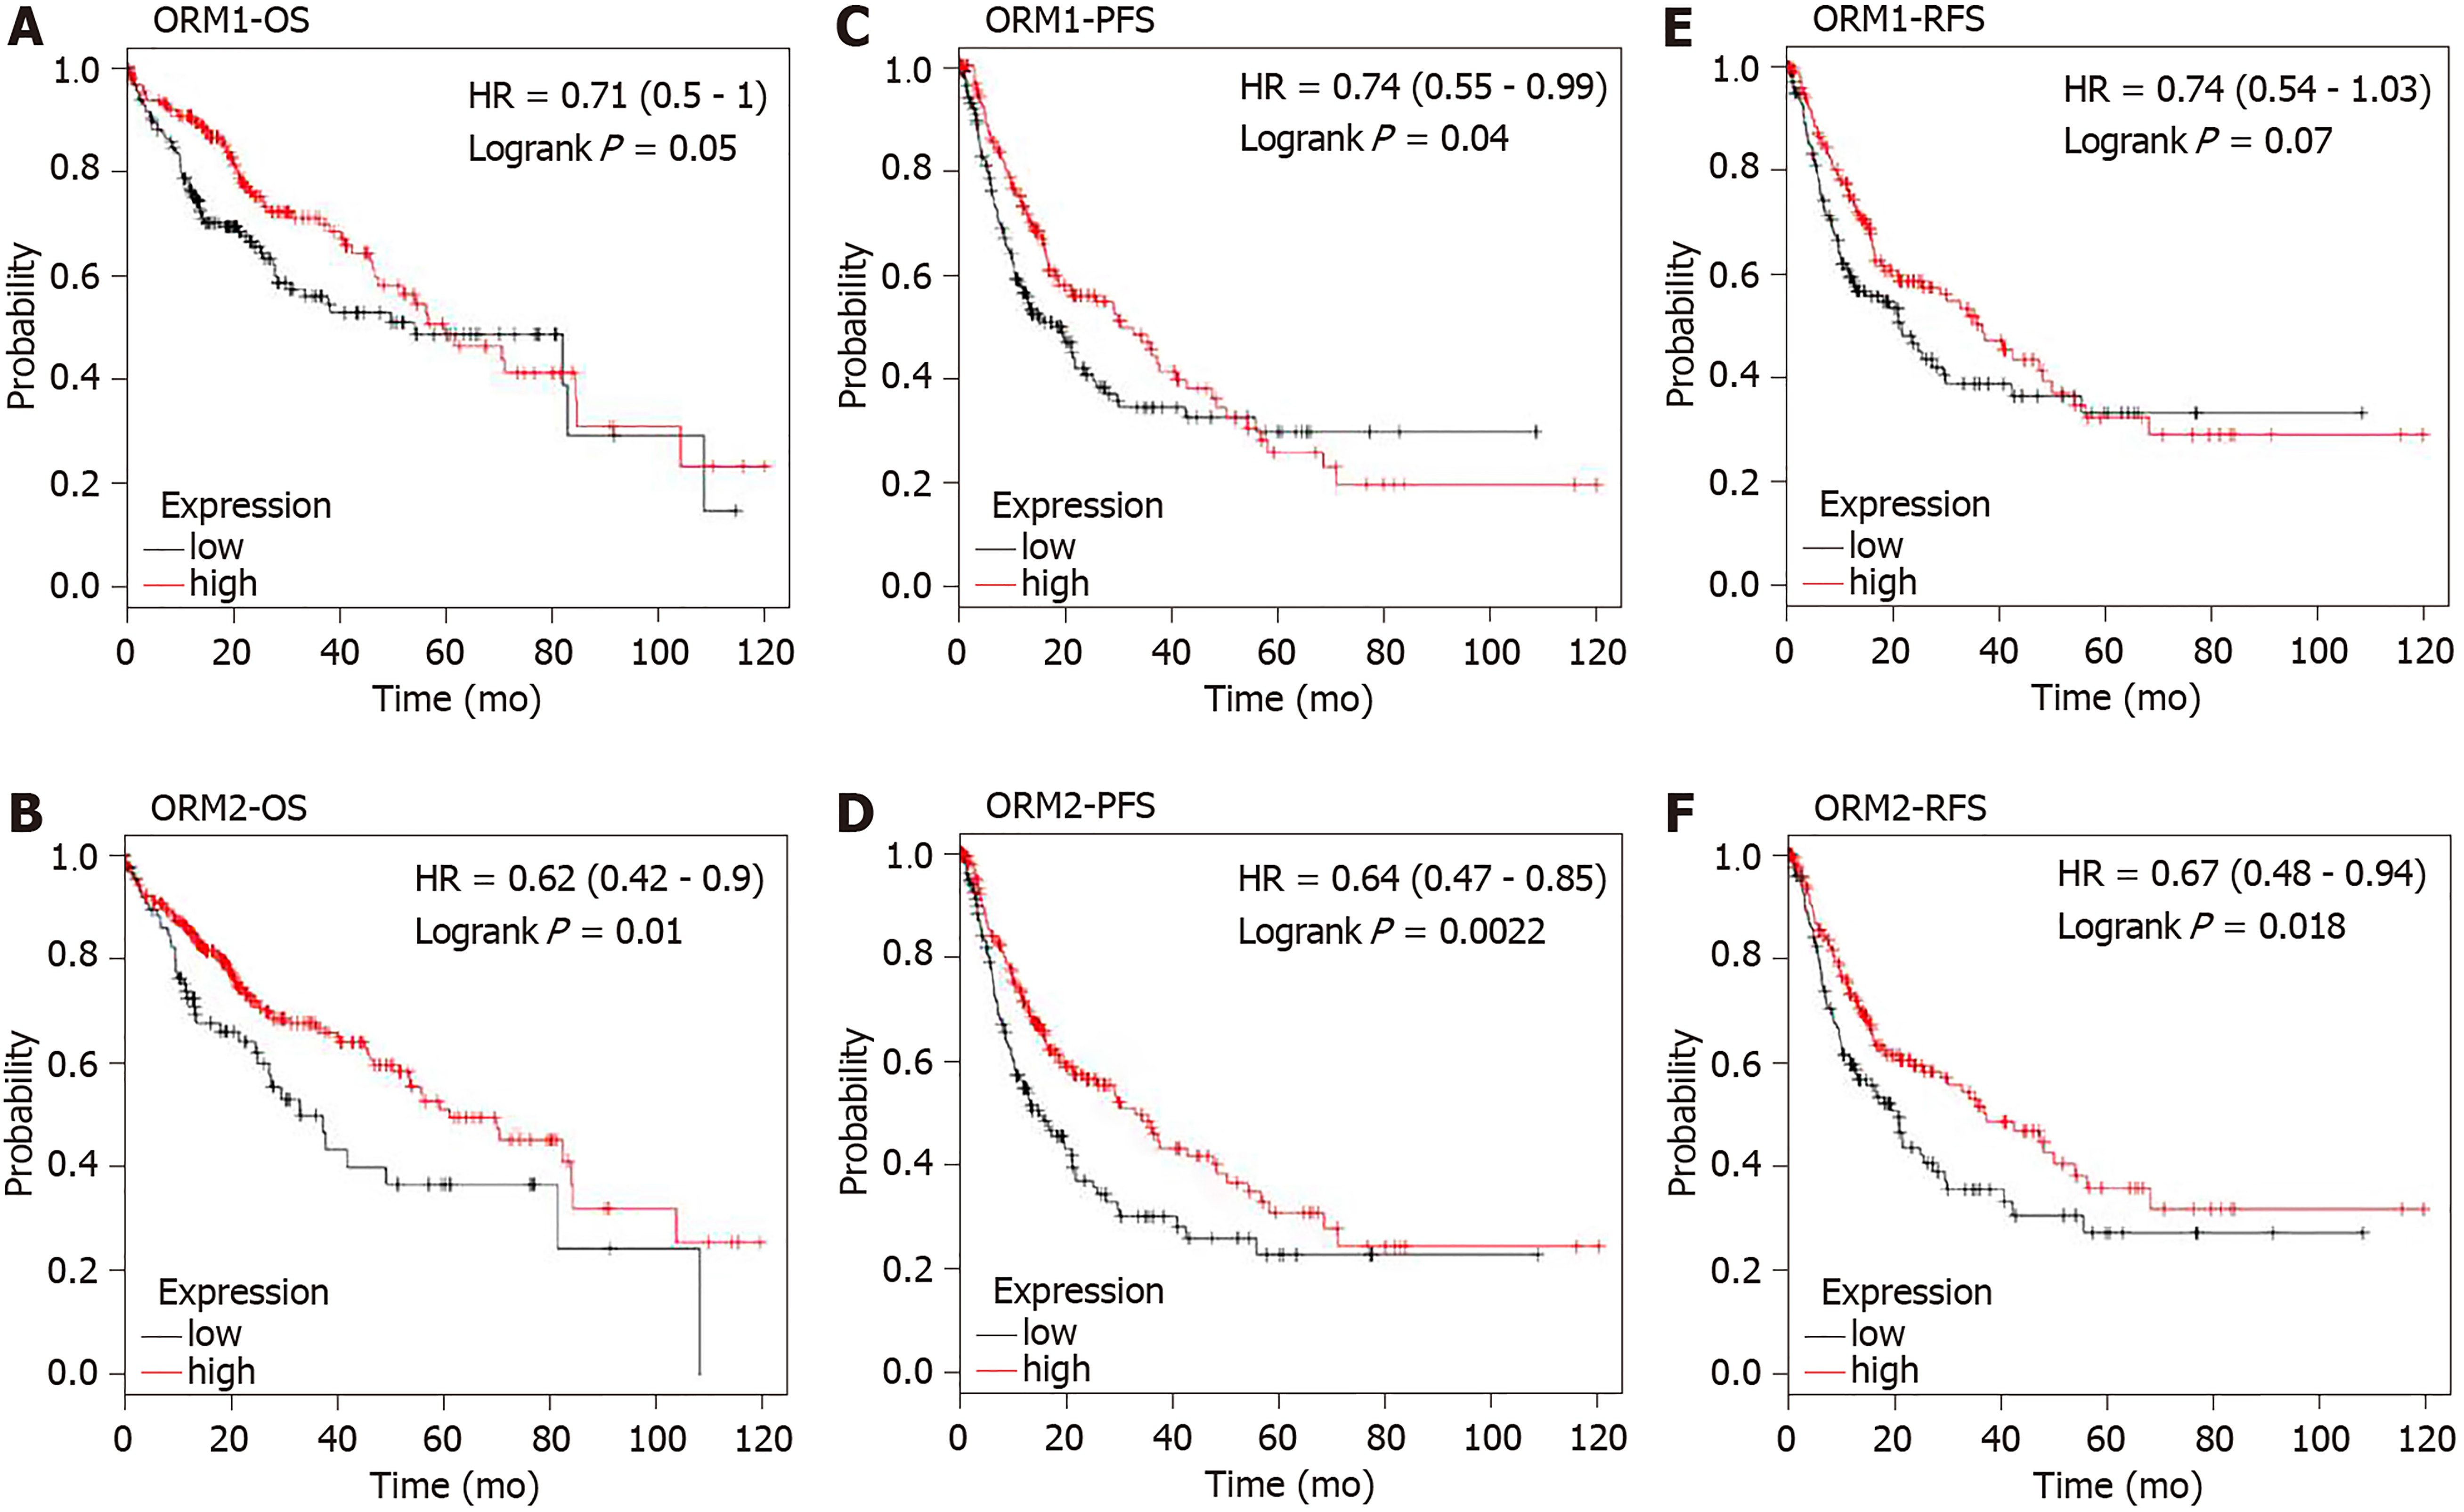
ORM1 and ORM2 were both downregulated in liver tumors. Combined with the results of high ORM1 and ORM2 expression in normal liver tissues, we hypothesized that ORMs might play an important role in liver function. To confirm this hypothesis, the effect of ORM expression on liver cancer patient survival rate was examined by the Kaplan Meier plotter. Results revealed that the OS and RFS between the high ORM1 and lower ORM1 groups have no significant difference, and performed slightly differently in PFS analysis. The higher ORM2 patient group showed better survival rates in OS, PFS and RFS analysis (Figure 4). As mentioned above, we identified that ORM2 was decreased in liver tumor tissues compared with adjacent normal tissues. We thus believe that ORM2 might play a role in normal liver function, and that its downregulation might be involved in liver cancer development. ORM2 has the potential role of functioning as a biomarker for liver cancer patients.
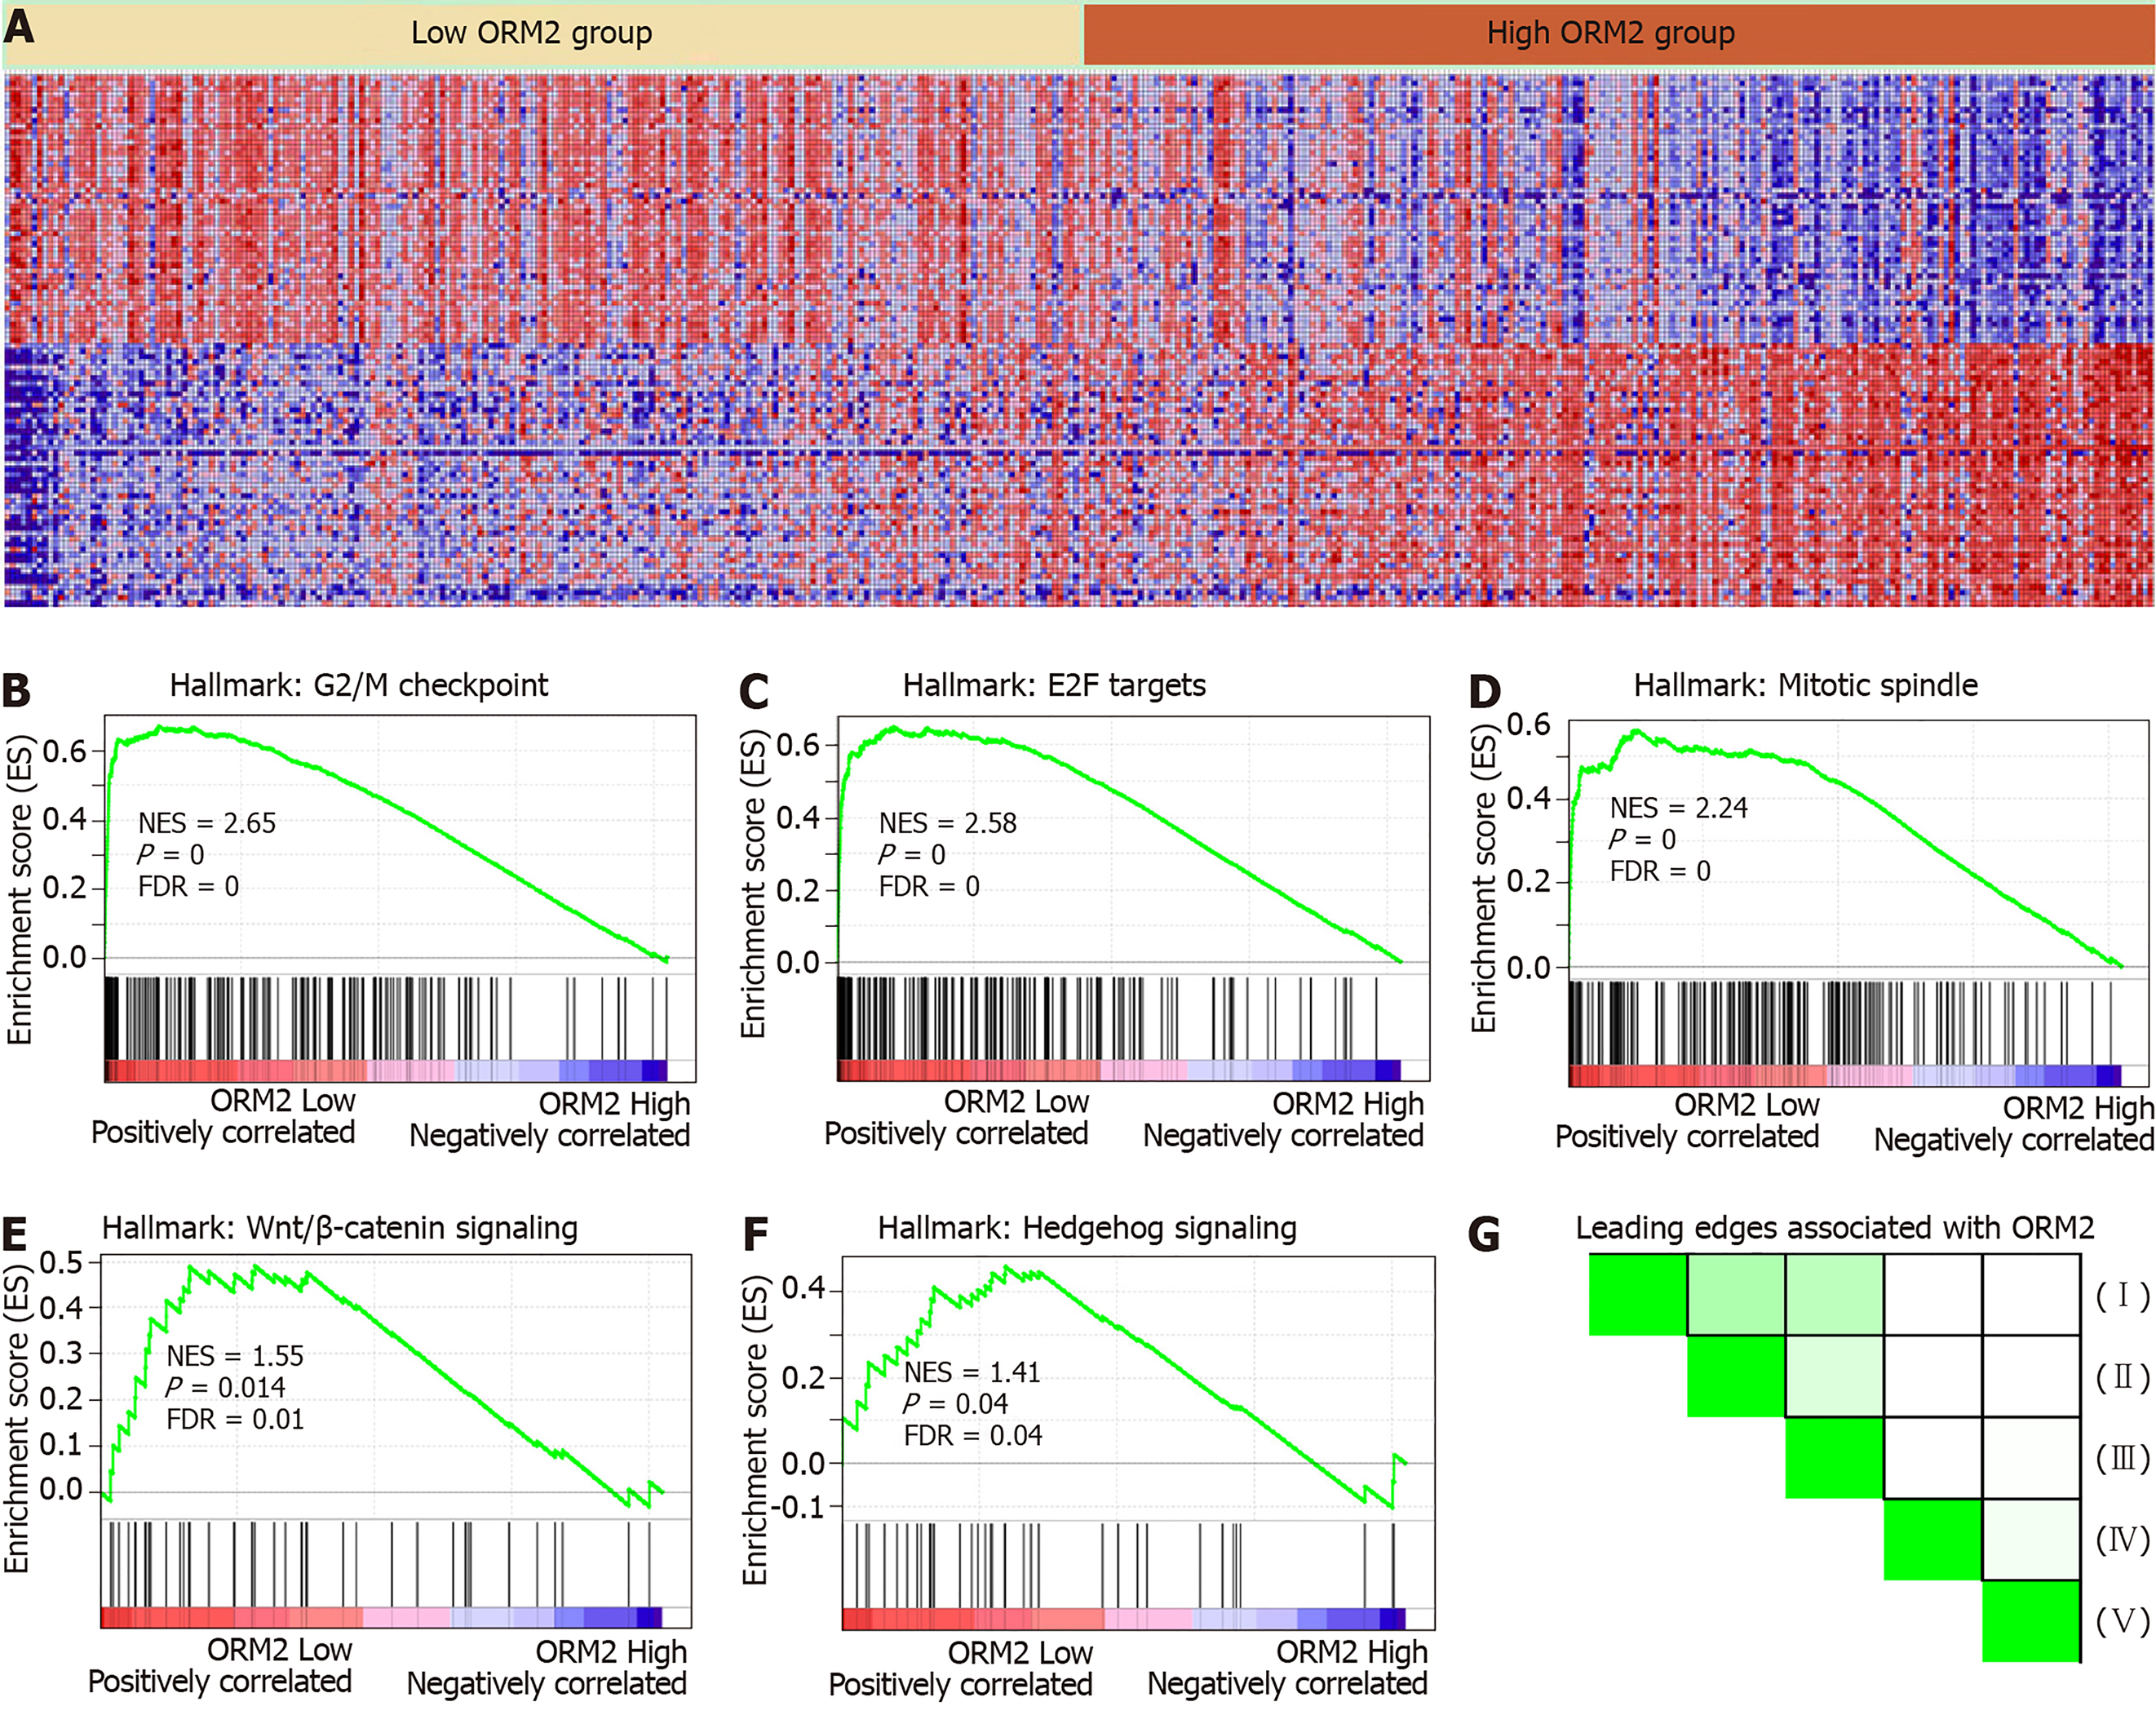
ORM2 expression was decreased in liver tumor tissues, and survival rate analysis also revealed that patients with lower ORM2 expression represent a poorer prognosis. Furthermore, ORM2 could act as a novel prognostic factor for liver cancer patients. Considering the potential applicable value of ORM2 in liver cancer, we further evaluated the regulatory network of ORM2 with gene enrichment analysis using the TCGA liver cancer database. As shown in Figure 5B-F, the signaling mechanism in liver cancer, we first reported that ORM2 positively associated with G2/M checkpoint signaling, E2F targets pathways, mitotic spindle regulation, Wnt/β-catenin and hedgehog signaling pathways. The G2/M checkpoint and mitotic spindle signaling pathways are important for the regulation of cancer cell proliferation. Additionally, E2F was reported as a transcription factor, and its target genes are widely involved in the regulation of DNA replication, cell cycle regulation, DNA repair and tumor differentiation[23-25]. Furthermore, Wnt/β-catenin and hedgehog signaling were widely reported to be classical cancer-promoting signaling pathways, which are commonly activated during the development of some cancer types[26-28], with liver cancer representing one of the most significant types[29,30]. Furthermore, leading edges analysis also revealed the close correlation between ORM2 and these cancer-promoting pathways, suggesting that ORM2 is involved in the regulation of liver cancer by mediating these cancer-promoting pathways and their downstream targets.
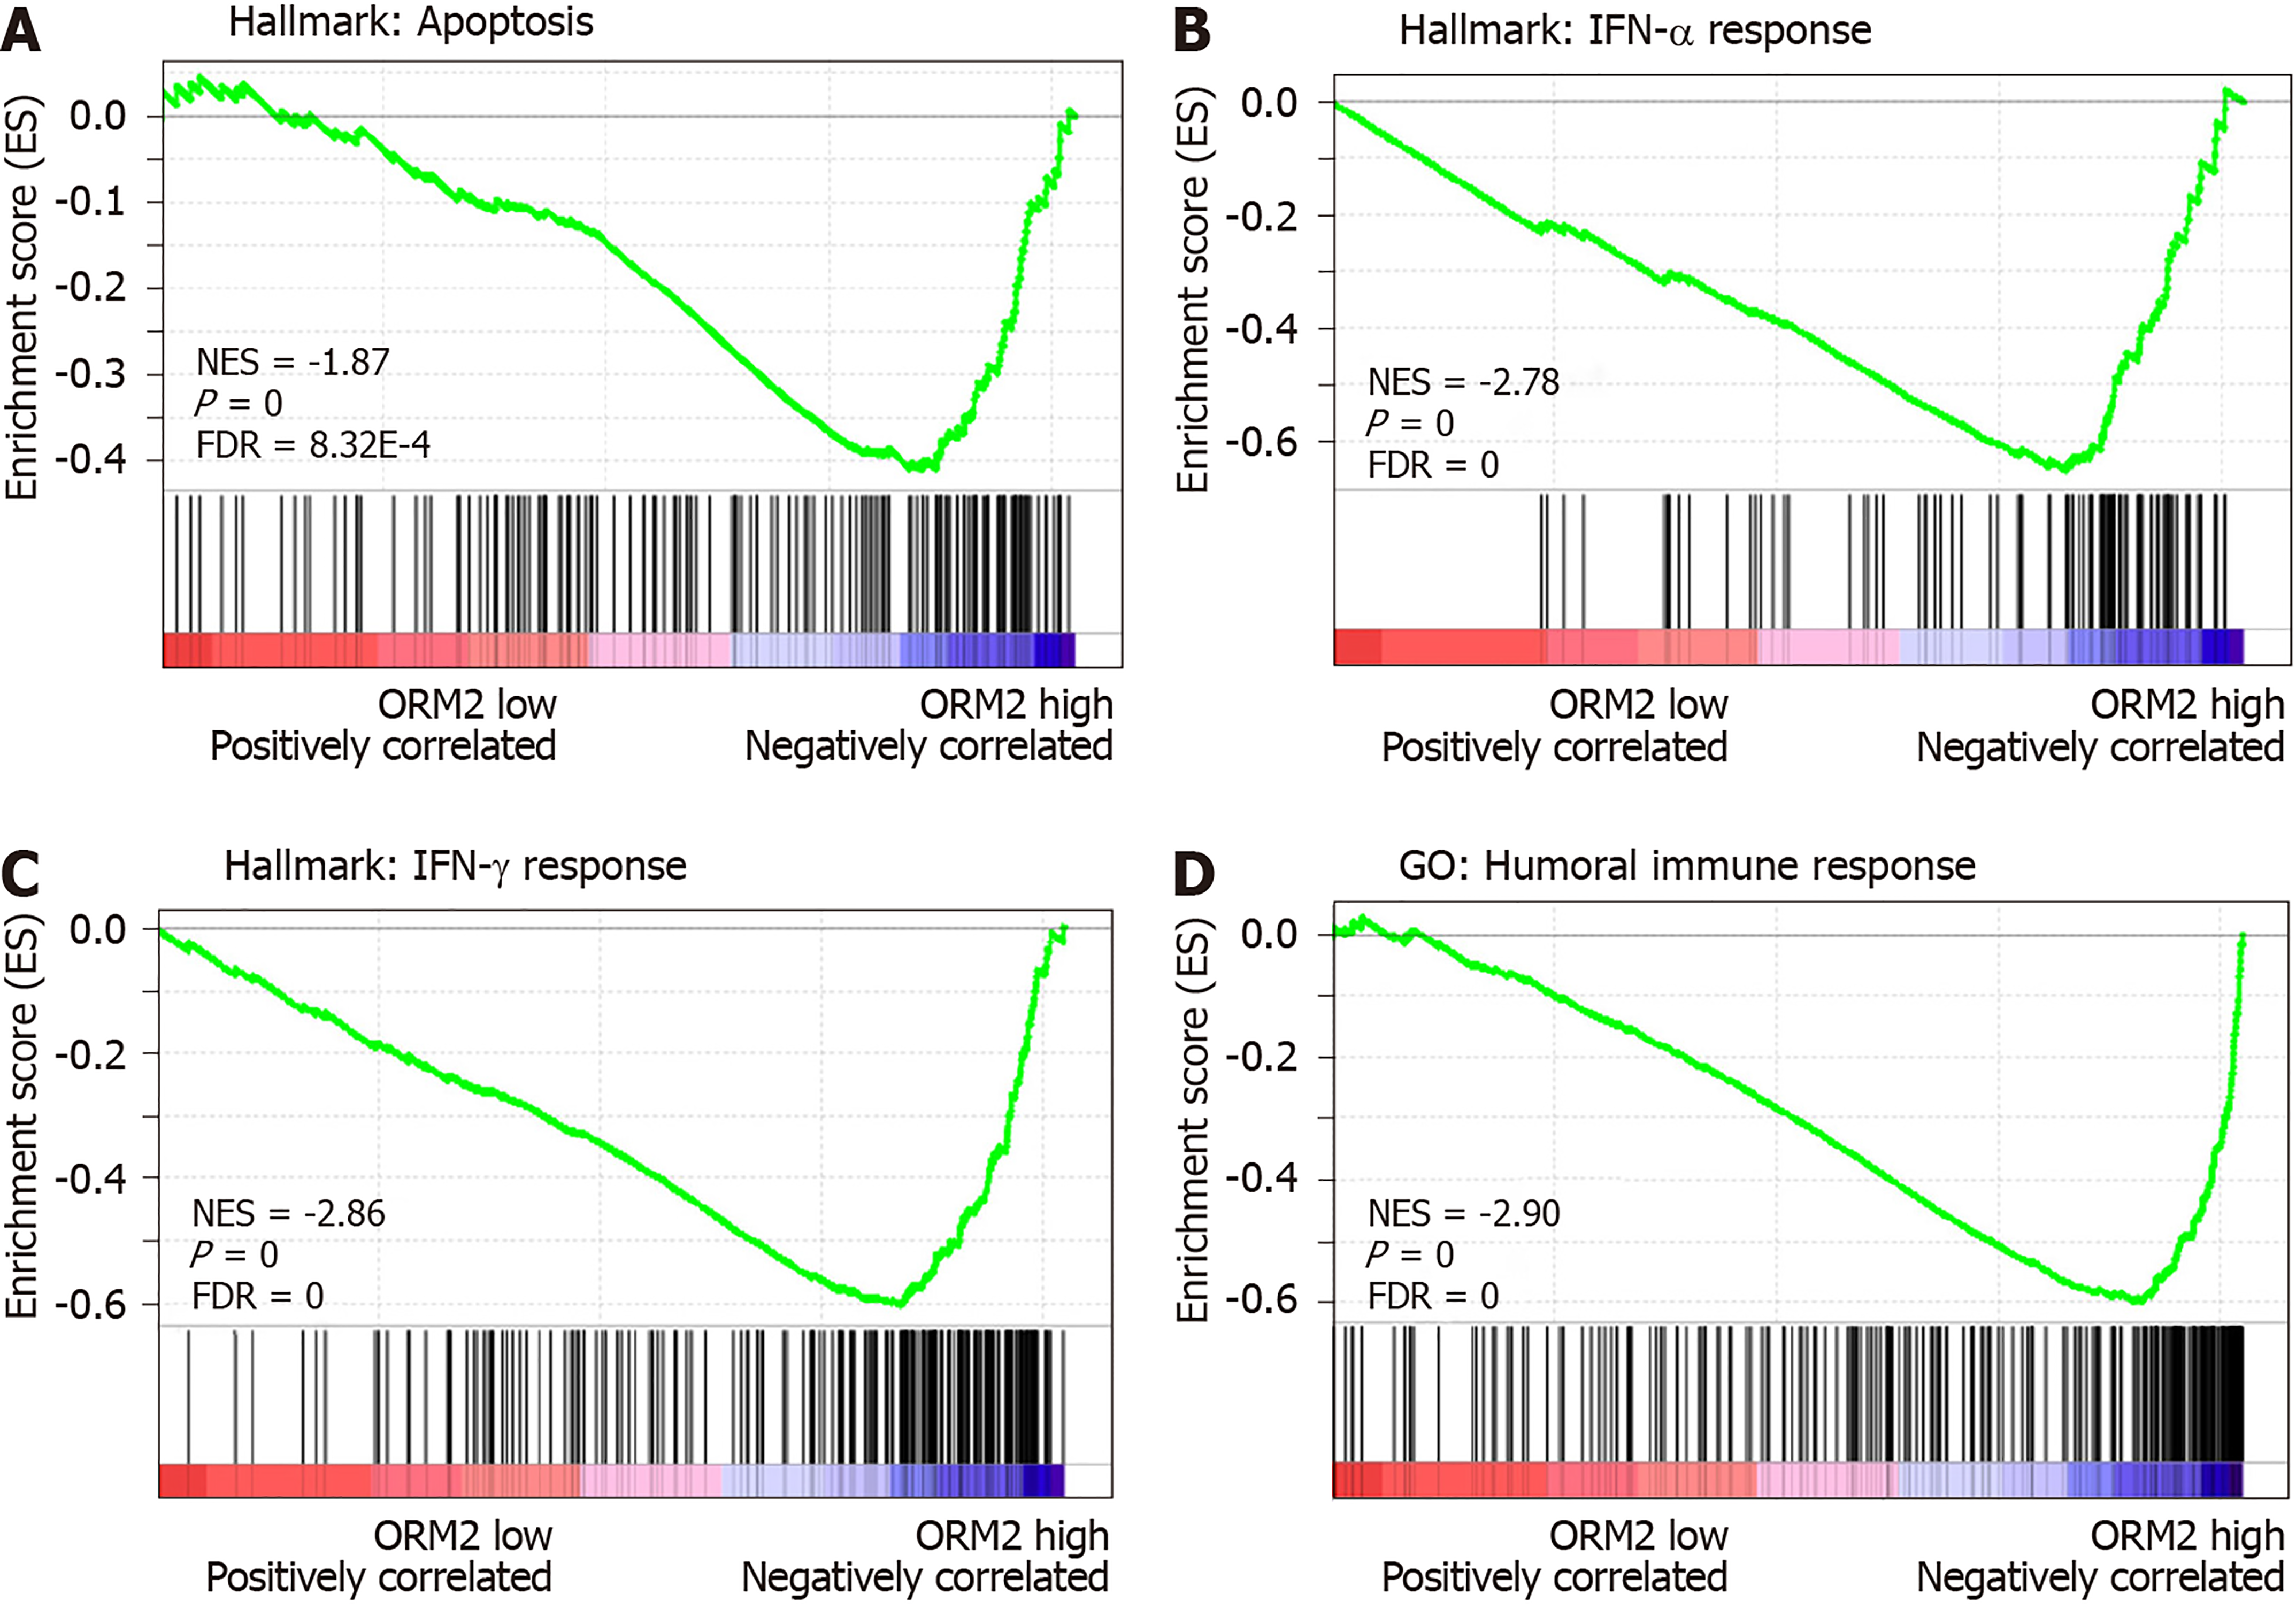
We identified that downregulated ORM2 was positively associated with cancer-promoting signaling pathways, including Wnt/β-catenin and hedgehog signaling, and involved in the regulation of proliferation by cell cycle activation. This revealed that ORM2 downregulation in liver tumors may contribute to the development of liver cancer. To further understand the potential mechanism of ORM2 in the development of liver cancer, this study also explored the negative regulation of ORM2 in liver cancer. Interestingly, the results showed that the downregulation of ORM2 was negatively associated with apoptosis (Figure 6A). Considering the importance of interferon (IFN) treatment in clinical liver cancer therapy[31,32], this study also revealed that decreased ORM2 was significantly correlated with the response of IFN treatment (Figure 6B and C), including IFN-α and IFN-γ. To further evaluate the role of ORM2 in the regulation of tumor immunity in liver cancer, we also evaluated the correlation between ORM2 expression and the humoral immune response, and the results showed a high enrichment score (Figure 6D). From these results, we have reason to believe that the downregulation of ORM2 in liver tumors is involved in the regulation of tumor immunity. In addition, the negative enrichment results suggest that decreased ORM2 expression in liver tumors might contribute to immune suppression by the anti-tumor immune response.
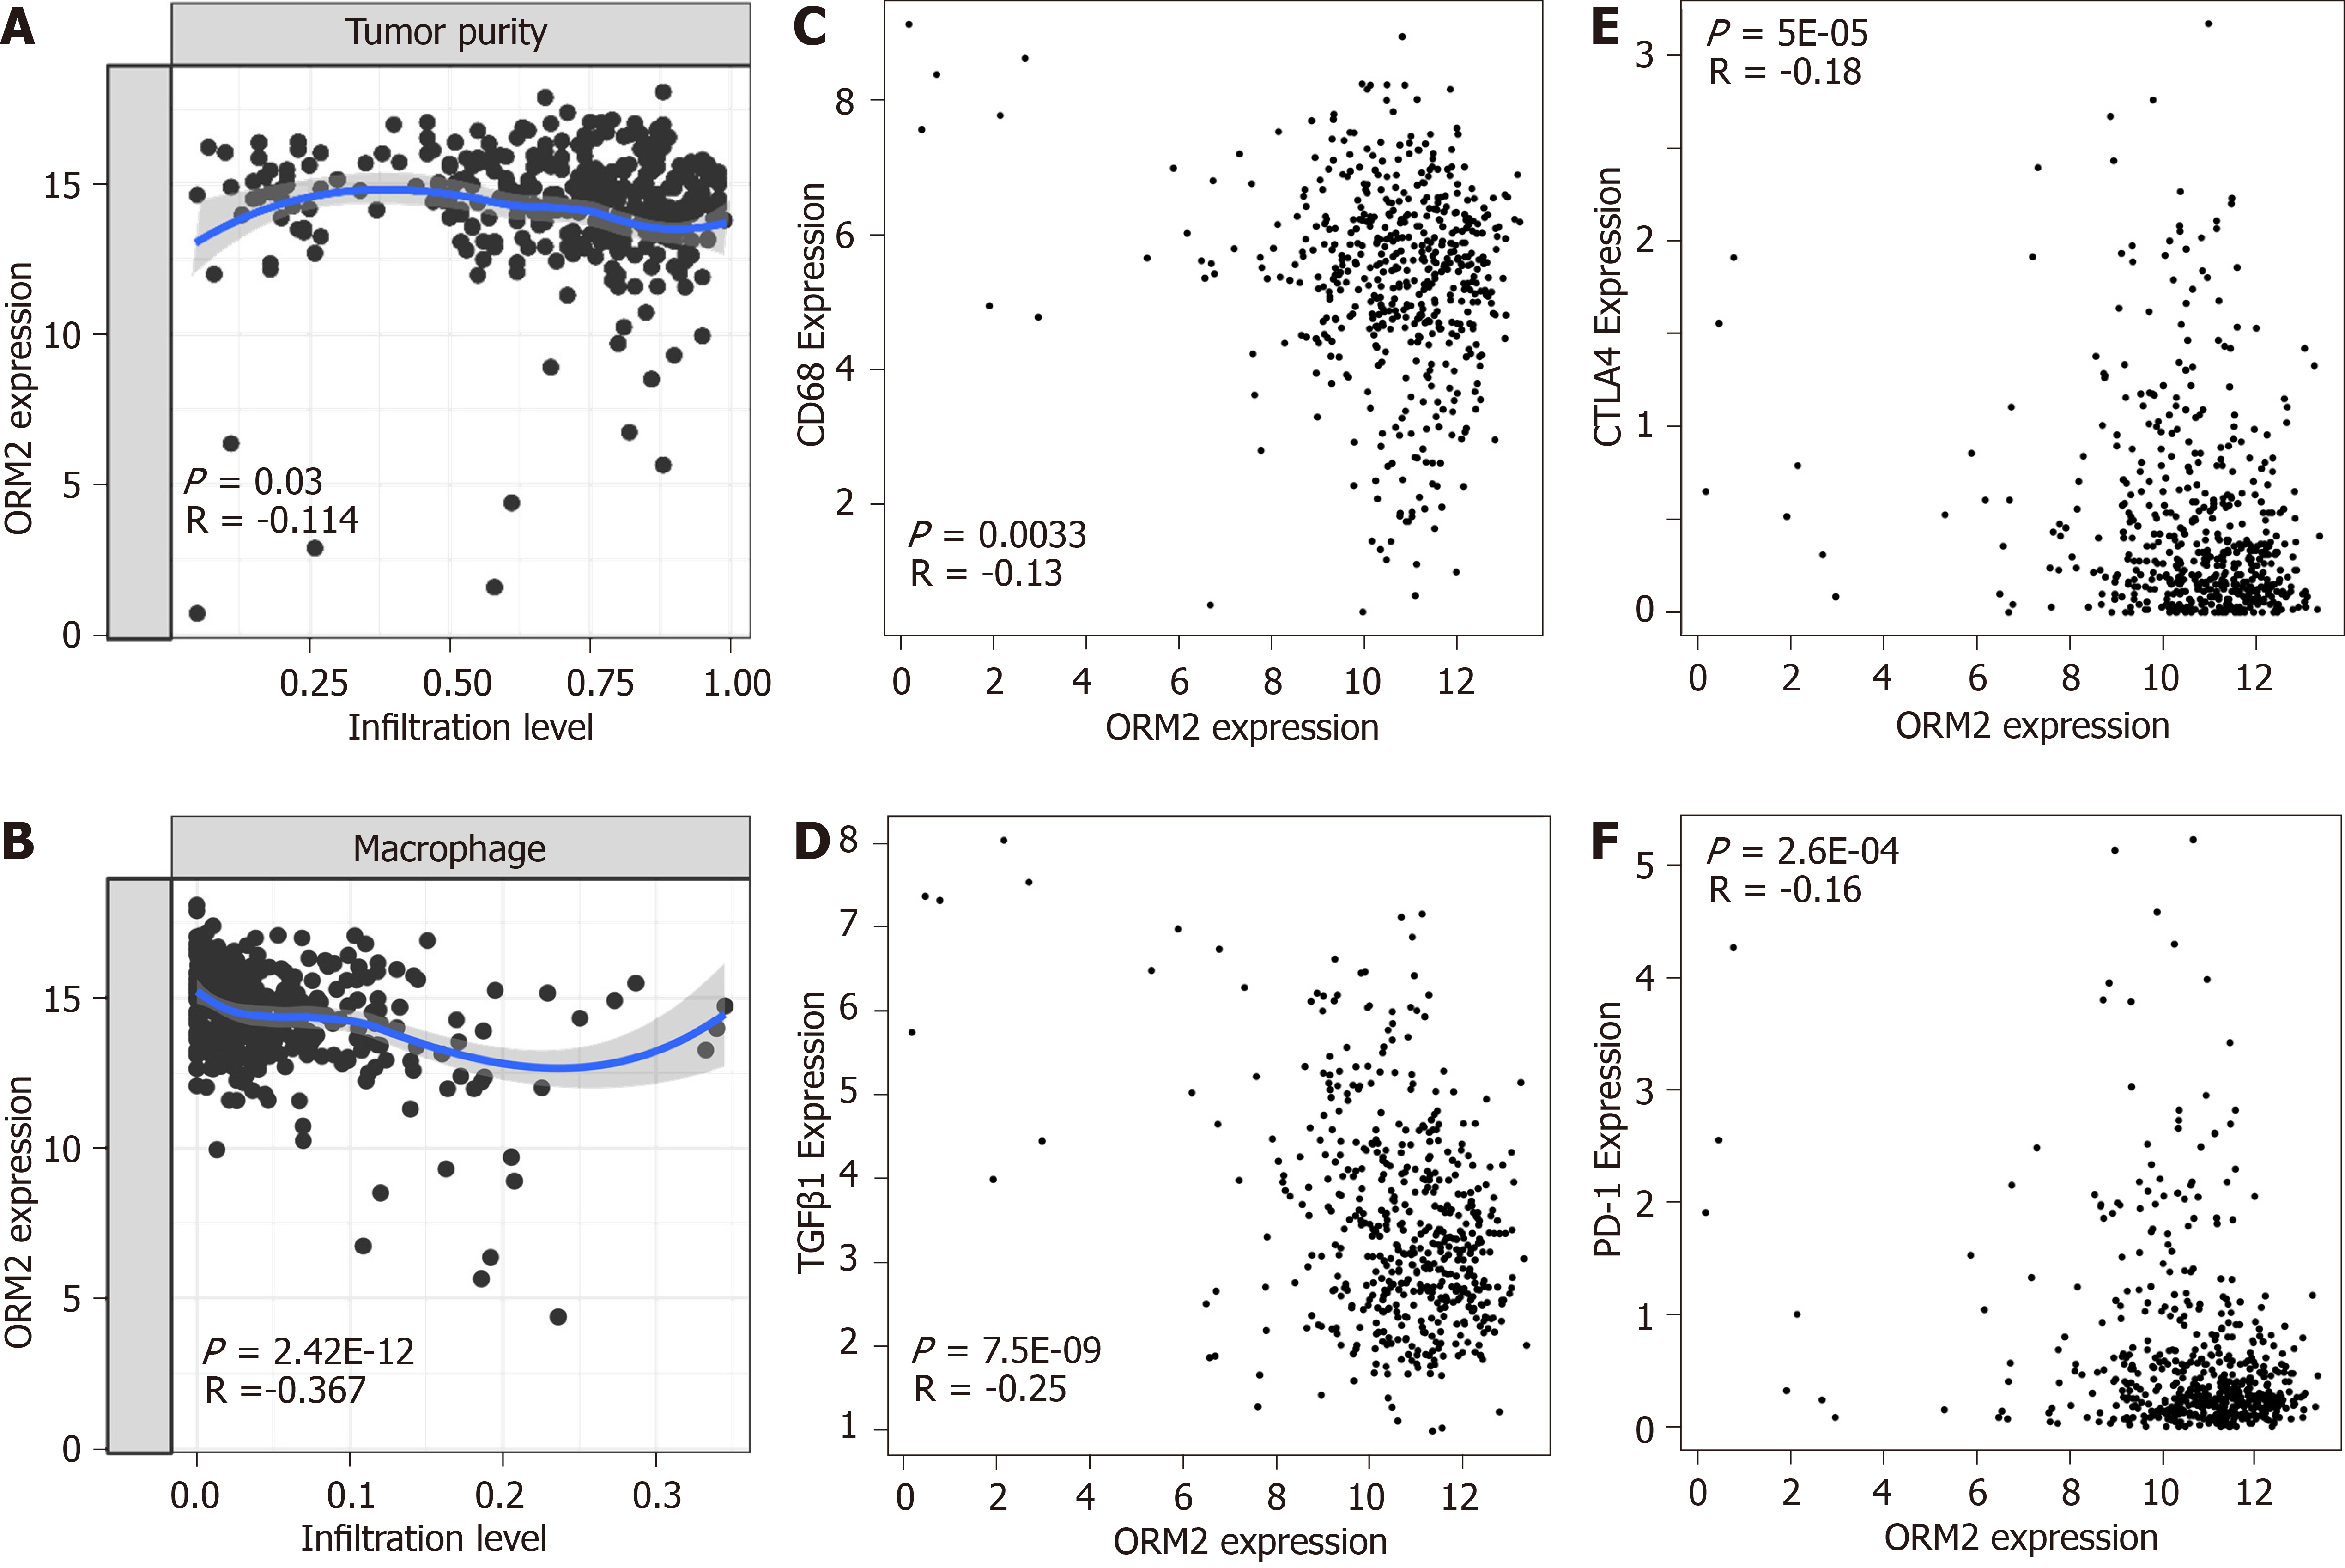
In Figure 6, we first evaluated the association of ORM2 and tumor immuno-suppression to deeply understand the correlation of ORM2 with the regulation of tumor immunity. Firstly, this study examined tumor purity and ORM2 expression in liver tumor tissues, and the results showed that ORM2 expression negatively correlated with tumor purity (Figure 7A). This suggested that many other cell types infiltrated into the liver tumor tissues. Since many studies have revealed the importance of macrophages in the process of tumor immunosuppression, we further tested the infiltration levels of macrophages and ORM2 expression levels, and their significantly negative correlation suggested that macrophages might play an important role in ORM2-mediated immunosuppression (Figure 7B). According to a previous study, most of the infiltrated macrophages in tumor tissues are tumor-associated macrophages (TAMs), shown to be M2-like[33]. To confirm this hypothesis, the correlation of ORM2 and TAM-related markers (CD68 and TGFβ1) was analyzed, and the results revealed a significantly negative correlation, suggesting that higher TAMs result from decreased ORM2 in tumor tissues. Immune checkpoint regulation was essential for T cell-mediated cancer-killing effects, and decreased ORM2 in immunosuppression was associated with the regulation of immune checkpoints. To validate this hypothesis, two classical immunosuppression checkpoints, CTLA-4 and PD-1, were subjected to analysis of expression correlation with ORM2. As shown in Figure 7E and F, ORM2 expression was remarkably negatively correlated with CTLA-4 and PD-1, revealing that decreased ORM2 in liver tumor tissues showed higher CTLA-4 and PD-1 expression in tumor tissues. From this aspect, downregulated ORM2 in liver tumors also gave us some guidelines for liver cancer therapy, especially for immune therapy to treat liver cancer.
ORMs were reported to be acute-phage genes in a mouse model, and upon inflammation induction, ORM expression could be evaluated and reversed upon bodily injury. However, its expression and significance in cancer have not been fully studied. To understand the role of ORMs in the regulation of human bodily functions, we first explored the differential expression of ORMs in different organs. Interestingly, we identified that ORMs, including ORM1 and ORM2, were both highly specifically expressed in liver tissues (Figure 1), suggesting their potential regulation of liver function. Furthermore, in this study, we also explored the expression of ORMs in pan-cancer types, and our results showed that ORMs were overexpressed in breast invasive carcinoma, colon adenocarcinoma, head and neck squamous cell carcinoma, kidney renal clear cell carcinoma, kidney renal papillary cell carcinoma, rectum adenocarcinoma, and uterine corpus endometrial carcinoma. In cholangiocarcinoma, esophageal carcinoma and lung squamous cell carcinoma, ORMs were significantly decreased in tumor tissues (Figure 2). Previous reports revealed the potential role of ORM2 in the development of colorectal cancer[34], and these results signify that ORMs may vary in their functional regulation of distinct organs. Notably, we confirmed the downregulation of ORMs in liver cancer (Figure 3), as well as the significance of ORMs in liver cancer. To state the problem, the effect of ORMs on the survival rate of liver cancer patients was the subjected of this study, and we showed that ORM2, but not ORM1, could perform as a reliable biomarker for the prognostic prediction of liver cancer patients (Figure 4). As it was highly-expressed specifically in liver tissue, downregulated ORM2 could serve as a competitive biomarker for better evaluation of liver cancer patients.
To better understand the role of ORM2 in the regulation of liver cancer, this study also revealed the enrichment analysis of ORM2 in liver cancer patients. To our surprise, we first identified that downregulated ORM2 expression was positively associated with the G2/M checkpoint, E2F target signaling pathway, mitotic spindle, Wnt/β-catenin and hedgehog signaling pathways (Figure 5). As in previous studies, these pathways were considered to be cancer-promoting. This is combined with the specific high expression of ORM2 in normal liver (Figure 1) and its significantly decreased expression in liver tumors. We therefore have reason to believe that decreased ORM2 might be a marker for liver cancer. Besides, this study also analyzed the negative enrichment of ORM2 in liver cancer, and apoptosis was significantly enriched. Moreover, we also evaluated the close association between the IFN treatment response and ORM2 in liver cancer. As IFN treatment in clinical liver cancer therapy is used in immune therapy, the previous study showed ORM1 could regulate the polarization of monocytes to the macrophage M2b-phenotype to control opportunistic infection[35]. As a similar isoform, it is unclear whether ORM2 also functions in the immune response. Therefore, we assigned the association between ORM2 and the humoral immune response in liver cancer. The significant negative association provided a new direction for the study of ORM2 in liver cancer (Figure 6). In detailed analysis, ORM2 was closely involved in tumor-associated macrophage (TAM) infiltration and the T-cell mediated checkpoint in liver tumor tissue (Figure 7). This might contribute to the tumor immunosuppression mediated by decreased ORM2. As was recently reported, the role of checkpoint therapy in liver cancer was poor, the most important reason being the low expression of immune checkpoints in liver cancer patients. It is therefore essential to pre-examine the expression of immune checkpoints before clinical therapy. Excitingly, downregulated ORM2 could be another marker for efficiently predicting the need to apply immune checkpoint therapy.
Liver cancer is an important factor in cancer-related death, where the rate of mortality is significantly higher than the rate of morbidity. Many factors contribute to the poor prognosis of liver cancer, and the deficiency of drugs is worthy of attention. Furthermore, drug resistance could shorten the survival time of liver cancer patients. Thus, to screen a novel and efficient biomarker is important for optimizing treatment therapies for liver cancer patients.
To confirm the expression and significance of orosomucoid genes (ORMs) in liver cancer, especially for assessing the prognostic value of ORM2 in liver cancer.
This study aimed to evaluate the expression of ORM genes in liver cancer, and to reveal its significance for patient prognosis. Besides, this study also aimed to screen the potential mechanism of ORM2’s involvement in the development of liver cancer.
Different human tissues were included to evaluate the expression of ORM1 and ORM2 as part of the HPA RNA-seq project. Analysis of ORM1 and ORM2 expression in different tumor types was achieved using the HCCDB database and TIMER portal. ORM1 and ORM2 expression in liver tumor tissues and surrounding normal tissues were tested using the TCGA database and GEO series, including GSE36376 and GSE14520. Survival rate analysis between ORM1 and ORM2 high or low expression groups, respectively, was assessed by a Kaplan-Meier plotter portal, including the overall survival (OS), progression-free survival (PFS) and relapse-free survival (RFS). The potential mechanism associated with ORM2 was evaluated by Gene Set Enrichment Analysis (GSEA). The correlation between ORM2 expression and the infiltration of tumor and macrophage cells was analyzed using the TIMER portal. The expression of ORM2, CD68, TGFβ1, CTLA4, and PD-1 were assessed using the GEPIA database, and correlation analysis was performed on normal and tumor liver GTEx samples.
We determined that ORM1 and ORM2 are highly expressed in liver tissues, and, more interestingly, that ORM1 and ORM2 expression are downregulated in liver tumor tissues, which was also confirmed in cholangiocarcinomas, esophageal carcinomas and lung squamous cell carcinomas. The high ORM2 expression group showed better survival rates in liver cancer patients upon OS, PFS and RFS analysis. The GSEA analysis associated with ORM2 in liver cancer showed that ORM2 was closely associated with the G2/M, E2F, Wnt/β-catenin and Hedgehog signaling pathways. Besides, the ORM2 high-expression patients group showed a close association with apoptosis, an IFN-α response, IFN-γ response and humoral immune response in liver cancer. Correlation analysis also revealed a negative correlation between ORM2 and the macrophage infiltration level, CD68, TGFβ1, CTLA4 and PD-1 expression.
Our findings revealed that ORM1 and ORM2 are highly expressed in liver tissues, but downregulated in liver tumor tissues, suggesting that this is an important factor in the development of liver cancer. ORM2 could act as a good biomarker for predicting the prognosis of liver cancer patients, and it is closely associated with some cancer-promoting pathways.
In this project, we identified the downregulation of ORM1 and ORM2 in liver cancer, and revealed that ORM2 could perform as a novel biomarker to predict the prognosis of liver cancer patients. In the following work, multivariate analysis of ORM2 and its clinical applications could be further evaluated.
Manuscript source: Unsolicited manuscript
Specialty type: Gastroenterology and hepatology
Country of origin: China
Peer-review report classification
Grade A (Excellent): 0
Grade B (Very good): B, B
Grade C (Good): 0
Grade D (Fair): 0
Grade E (Poor): 0
P-Reviewer: Ulaşoğlu C, Tanabe S S-Editor: Gong ZM L-Editor: Filipodia E-Editor: Liu JH
| 1. | Wan JJ, Qin Z, Liu X. ORM Elevation in Response to Cognitive Impairment Is an Accompanying Phenomenon. CNS Neurosci Ther. 2016;22:723-724. [PubMed] [DOI] [Cited in This Article: ] [Cited by in Crossref: 4] [Cited by in F6Publishing: 4] [Article Influence: 0.7] [Reference Citation Analysis (0)] |
| 2. | Wan JJ, Wang PY, Zhang Y, Qin Z, Sun Y, Hu BH, Su DF, Xu DP, Liu X. Role of acute-phase protein ORM in a mice model of ischemic stroke. J Cell Physiol. 2019;234:20533-20545. [PubMed] [DOI] [Cited in This Article: ] [Cited by in Crossref: 14] [Cited by in F6Publishing: 22] [Article Influence: 4.4] [Reference Citation Analysis (0)] |
| 3. | Jo M, Kim JH, Song GJ, Seo M, Hwang EM, Suk K. Astrocytic Orosomucoid-2 Modulates Microglial Activation and Neuroinflammation. J Neurosci. 2017;37:2878-2894. [PubMed] [DOI] [Cited in This Article: ] [Cited by in Crossref: 61] [Cited by in F6Publishing: 89] [Article Influence: 12.7] [Reference Citation Analysis (0)] |
| 4. | Fernandes M, Husi H. Integrative Systems Biology Investigation of Fabry Disease. Diseases. 2016;4:pii: E35. [PubMed] [DOI] [Cited in This Article: ] [Cited by in Crossref: 7] [Cited by in F6Publishing: 8] [Article Influence: 1.0] [Reference Citation Analysis (0)] |
| 5. | Liu M, Huang C, Polu SR, Schneiter R, Chang A. Regulation of sphingolipid synthesis through Orm1 and Orm2 in yeast. J Cell Sci. 2012;125:2428-2435. [PubMed] [DOI] [Cited in This Article: ] [Cited by in Crossref: 62] [Cited by in F6Publishing: 70] [Article Influence: 5.8] [Reference Citation Analysis (0)] |
| 6. | Breslow DK, Collins SR, Bodenmiller B, Aebersold R, Simons K, Shevchenko A, Ejsing CS, Weissman JS. Orm family proteins mediate sphingolipid homeostasis. Nature. 2010;463:1048-1053. [PubMed] [DOI] [Cited in This Article: ] [Cited by in Crossref: 506] [Cited by in F6Publishing: 625] [Article Influence: 44.6] [Reference Citation Analysis (0)] |
| 7. | Han S, Lone MA, Schneiter R, Chang A. Orm1 and Orm2 are conserved endoplasmic reticulum membrane proteins regulating lipid homeostasis and protein quality control. Proc Natl Acad Sci USA. 2010;107:5851-5856. [PubMed] [DOI] [Cited in This Article: ] [Cited by in Crossref: 200] [Cited by in F6Publishing: 212] [Article Influence: 15.1] [Reference Citation Analysis (0)] |
| 8. | Lin H, Zhang Q, Li X, Wu Y, Liu Y, Hu Y. Identification of key candidate genes and pathways in hepatitis B virus-associated acute liver failure by bioinformatical analysis. Medicine (Baltimore). 2018;97:e9687. [PubMed] [DOI] [Cited in This Article: ] [Cited by in Crossref: 11] [Cited by in F6Publishing: 12] [Article Influence: 2.0] [Reference Citation Analysis (0)] |
| 9. | Butler LM, Hallström BM, Fagerberg L, Pontén F, Uhlén M, Renné T, Odeberg J. Analysis of Body-wide Unfractionated Tissue Data to Identify a Core Human Endothelial Transcriptome. Cell Syst. 2016;3:287-301.e3. [PubMed] [DOI] [Cited in This Article: ] [Cited by in Crossref: 30] [Cited by in F6Publishing: 20] [Article Influence: 2.5] [Reference Citation Analysis (0)] |
| 10. | Lian Q, Wang S, Zhang G, Wang D, Luo G, Tang J, Chen L, Gu J. HCCDB: A Database of Hepatocellular Carcinoma Expression Atlas. Genomics Proteomics Bioinformatics. 2018;16:269-275. [PubMed] [DOI] [Cited in This Article: ] [Cited by in Crossref: 118] [Cited by in F6Publishing: 174] [Article Influence: 29.0] [Reference Citation Analysis (0)] |
| 11. | Li T, Fan J, Wang B, Traugh N, Chen Q, Liu JS, Li B, Liu XS. TIMER: A Web Server for Comprehensive Analysis of Tumor-Infiltrating Immune Cells. Cancer Res. 2017;77:e108-e110. [PubMed] [DOI] [Cited in This Article: ] [Cited by in Crossref: 2728] [Cited by in F6Publishing: 3330] [Article Influence: 475.7] [Reference Citation Analysis (0)] |
| 12. | Li B, Fillmore N, Bai Y, Collins M, Thomson JA, Stewart R, Dewey CN. Evaluation of de novo transcriptome assemblies from RNA-Seq data. Genome Biol. 2014;15:553. [PubMed] [DOI] [Cited in This Article: ] [Cited by in Crossref: 190] [Cited by in F6Publishing: 196] [Article Influence: 19.6] [Reference Citation Analysis (0)] |
| 13. | Lim HY, Sohn I, Deng S, Lee J, Jung SH, Mao M, Xu J, Wang K, Shi S, Joh JW, Choi YL, Park CK. Prediction of disease-free survival in hepatocellular carcinoma by gene expression profiling. Ann Surg Oncol. 2013;20:3747-3753. [PubMed] [DOI] [Cited in This Article: ] [Cited by in Crossref: 71] [Cited by in F6Publishing: 95] [Article Influence: 8.6] [Reference Citation Analysis (0)] |
| 14. | Roessler S, Jia HL, Budhu A, Forgues M, Ye QH, Lee JS, Thorgeirsson SS, Sun Z, Tang ZY, Qin LX, Wang XW. A unique metastasis gene signature enables prediction of tumor relapse in early-stage hepatocellular carcinoma patients. Cancer Res. 2010;70:10202-10212. [PubMed] [DOI] [Cited in This Article: ] [Cited by in Crossref: 604] [Cited by in F6Publishing: 712] [Article Influence: 54.8] [Reference Citation Analysis (0)] |
| 15. | Roessler S, Long EL, Budhu A, Chen Y, Zhao X, Ji J, Walker R, Jia HL, Ye QH, Qin LX, Tang ZY, He P, Hunter KW, Thorgeirsson SS, Meltzer PS, Wang XW. Integrative genomic identification of genes on 8p associated with hepatocellular carcinoma progression and patient survival. Gastroenterology. 2012;142:957-966.e12. [PubMed] [DOI] [Cited in This Article: ] [Cited by in Crossref: 220] [Cited by in F6Publishing: 252] [Article Influence: 21.0] [Reference Citation Analysis (0)] |
| 16. | Barrett T, Wilhite SE, Ledoux P, Evangelista C, Kim IF, Tomashevsky M, Marshall KA, Phillippy KH, Sherman PM, Holko M, Yefanov A, Lee H, Zhang N, Robertson CL, Serova N, Davis S, Soboleva A. NCBI GEO: archive for functional genomics data sets--update. Nucleic Acids Res. 2013;41:D991-D995. [PubMed] [DOI] [Cited in This Article: ] [Cited by in Crossref: 4527] [Cited by in F6Publishing: 5667] [Article Influence: 472.3] [Reference Citation Analysis (0)] |
| 17. | Menyhárt O, Nagy Á, Győrffy B. Determining consistent prognostic biomarkers of overall survival and vascular invasion in hepatocellular carcinoma. R Soc Open Sci. 2018;5:181006. [PubMed] [DOI] [Cited in This Article: ] [Cited by in Crossref: 242] [Cited by in F6Publishing: 273] [Article Influence: 45.5] [Reference Citation Analysis (0)] |
| 18. | Treviño V, Tamez-Pena J. VALORATE: fast and accurate log-rank test in balanced and unbalanced comparisons of survival curves and cancer genomics. Bioinformatics. 2017;33:1900-1901. [PubMed] [DOI] [Cited in This Article: ] [Cited by in Crossref: 7] [Cited by in F6Publishing: 8] [Article Influence: 1.3] [Reference Citation Analysis (0)] |
| 19. | Subramanian A, Tamayo P, Mootha VK, Mukherjee S, Ebert BL, Gillette MA, Paulovich A, Pomeroy SL, Golub TR, Lander ES, Mesirov JP. Gene set enrichment analysis: a knowledge-based approach for interpreting genome-wide expression profiles. Proc Natl Acad Sci USA. 2005;102:15545-15550. [PubMed] [DOI] [Cited in This Article: ] [Cited by in Crossref: 27252] [Cited by in F6Publishing: 31419] [Article Influence: 1653.6] [Reference Citation Analysis (0)] |
| 20. | Mootha VK, Lindgren CM, Eriksson KF, Subramanian A, Sihag S, Lehar J, Puigserver P, Carlsson E, Ridderstråle M, Laurila E, Houstis N, Daly MJ, Patterson N, Mesirov JP, Golub TR, Tamayo P, Spiegelman B, Lander ES, Hirschhorn JN, Altshuler D, Groop LC. PGC-1alpha-responsive genes involved in oxidative phosphorylation are coordinately downregulated in human diabetes. Nat Genet. 2003;34:267-273. [PubMed] [DOI] [Cited in This Article: ] [Cited by in Crossref: 6388] [Cited by in F6Publishing: 6567] [Article Influence: 312.7] [Reference Citation Analysis (0)] |
| 21. | Tang Z, Li C, Kang B, Gao G, Li C, Zhang Z. GEPIA: a web server for cancer and normal gene expression profiling and interactive analyses. Nucleic Acids Res. 2017;45:W98-W102. [PubMed] [DOI] [Cited in This Article: ] [Cited by in Crossref: 5550] [Cited by in F6Publishing: 5994] [Article Influence: 856.3] [Reference Citation Analysis (0)] |
| 22. | GTEx Consortium; Laboratory. Data Analysis &Coordinating Center (LDACC)—Analysis Working Group; Statistical Methods groups—Analysis Working Group; Enhancing GTEx (eGTEx) groups; NIH Common Fund; NIH/NCI; NIH/NHGRI; NIH/NIMH; NIH/NIDA; Biospecimen Collection Source Site—NDRI; Biospecimen Collection Source Site—RPCI; Biospecimen Core Resource—VARI; Brain Bank Repository—University of Miami Brain Endowment Bank; Leidos Biomedical—Project Management; ELSI Study; Genome Browser Data Integration &Visualization—EBI; Genome Browser Data Integration &Visualization—UCSC Genomics Institute, University of California Santa Cruz; Lead analysts; Laboratory, Data Analysis &Coordinating Center (LDACC); NIH program management; Biospecimen collection; Pathology; eQTL manuscript working group, Battle A, Brown CD, Engelhardt BE, Montgomery SB. Genetic effects on gene expression across human tissues. Nature. 2017;550:204-213. [PubMed] [DOI] [Cited in This Article: ] [Cited by in Crossref: 3264] [Cited by in F6Publishing: 2404] [Article Influence: 343.4] [Reference Citation Analysis (0)] |
| 23. | Thangavel C, Boopathi E, Liu Y, Haber A, Ertel A, Bhardwaj A, Addya S, Williams N, Ciment SJ, Cotzia P, Dean JL, Snook A, McNair C, Price M, Hernandez JR, Zhao SG, Birbe R, McCarthy JB, Turley EA, Pienta KJ, Feng FY, Dicker AP, Knudsen KE, Den RB. RB Loss Promotes Prostate Cancer Metastasis. Cancer Res. 2017;77:982-995. [PubMed] [DOI] [Cited in This Article: ] [Cited by in Crossref: 46] [Cited by in F6Publishing: 56] [Article Influence: 7.0] [Reference Citation Analysis (0)] |
| 24. | Ferreira WA, Araújo MD, Anselmo NP, de Oliveira EH, Brito JR, Burbano RR, Harada ML, Borges Bdo N. Expression Analysis of Genes Involved in the RB/E2F Pathway in Astrocytic Tumors. PLoS One. 2015;10:e0137259. [PubMed] [DOI] [Cited in This Article: ] [Cited by in Crossref: 12] [Cited by in F6Publishing: 12] [Article Influence: 1.3] [Reference Citation Analysis (0)] |
| 25. | Kent LN, Leone G. The broken cycle: E2F dysfunction in cancer. Nat Rev Cancer. 2019;19:326-338. [PubMed] [DOI] [Cited in This Article: ] [Cited by in Crossref: 333] [Cited by in F6Publishing: 404] [Article Influence: 80.8] [Reference Citation Analysis (0)] |
| 26. | Krishnamurthy N, Kurzrock R. Targeting the Wnt/beta-catenin pathway in cancer: Update on effectors and inhibitors. Cancer Treat Rev. 2018;62:50-60. [PubMed] [DOI] [Cited in This Article: ] [Cited by in Crossref: 616] [Cited by in F6Publishing: 657] [Article Influence: 109.5] [Reference Citation Analysis (0)] |
| 27. | Tang J, Chen L, Wang Z, Huang G, Hu X. SOX2 mediates crosstalk between Sonic Hedgehog and the Wnt/β-catenin signaling pathway to promote proliferation of pituitary adenoma cells. Oncol Lett. 2019;18:81-86. [PubMed] [DOI] [Cited in This Article: ] [Cited by in Crossref: 2] [Cited by in F6Publishing: 3] [Article Influence: 0.6] [Reference Citation Analysis (0)] |
| 28. | Katoh M. Genomic testing, tumor microenvironment and targeted therapy of Hedgehog-related human cancers. Clin Sci (Lond). 2019;133:953-970. [PubMed] [DOI] [Cited in This Article: ] [Cited by in Crossref: 44] [Cited by in F6Publishing: 71] [Article Influence: 14.2] [Reference Citation Analysis (0)] |
| 29. | Blagotinsek K, Rozman D. Targeting Signalling Pathways in Hepatocellular Carcinoma. Curr Pharm Des. 2017;23:170-175. [PubMed] [DOI] [Cited in This Article: ] [Cited by in Crossref: 12] [Cited by in F6Publishing: 16] [Article Influence: 2.7] [Reference Citation Analysis (0)] |
| 30. | Giakoustidis A, Giakoustidis D, Mudan S, Sklavos A, Williams R. Molecular signalling in hepatocellular carcinoma: Role of and crosstalk among WNT/ß-catenin, Sonic Hedgehog, Notch and Dickkopf-1. Can J Gastroenterol Hepatol. 2015;29:209-217. [PubMed] [DOI] [Cited in This Article: ] [Cited by in Crossref: 38] [Cited by in F6Publishing: 40] [Article Influence: 4.4] [Reference Citation Analysis (0)] |
| 31. | Takehara T, Uemura A, Tatsumi T, Suzuki T, Kimura R, Shiotani A, Ohkawa K, Kanto T, Hiramatsu N, Hayashi N. Natural killer cell-mediated ablation of metastatic liver tumors by hydrodynamic injection of IFNalpha gene to mice. Int J Cancer. 2007;120:1252-1260. [PubMed] [DOI] [Cited in This Article: ] [Cited by in Crossref: 22] [Cited by in F6Publishing: 23] [Article Influence: 1.4] [Reference Citation Analysis (0)] |
| 32. | Koike K, Takaki A, Tatsukawa M, Suzuki M, Shiraha H, Iwasaki Y, Sakaguchi K, Shiratori Y. Combination of 5-FU and IFNalpha enhances IFN signaling pathway and caspase-8 activity, resulting in marked apoptosis in hepatoma cell lines. Int J Oncol. 2006;29:1253-1261. [PubMed] [Cited in This Article: ] |
| 33. | Pan JH, Zhou H, Cooper L, Huang JL, Zhu SB, Zhao XX, Ding H, Pan YL, Rong L. LAYN Is a Prognostic Biomarker and Correlated With Immune Infiltrates in Gastric and Colon Cancers. Front Immunol. 2019;10:6. [PubMed] [DOI] [Cited in This Article: ] [Cited by in Crossref: 151] [Cited by in F6Publishing: 211] [Article Influence: 42.2] [Reference Citation Analysis (0)] |
| 34. | Zhang X, Xiao Z, Liu X, Du L, Wang L, Wang S, Zheng N, Zheng G, Li W, Zhang X, Dong Z, Zhuang X, Wang C. The potential role of ORM2 in the development of colorectal cancer. PLoS One. 2012;7:e31868. [PubMed] [DOI] [Cited in This Article: ] [Cited by in Crossref: 34] [Cited by in F6Publishing: 37] [Article Influence: 3.1] [Reference Citation Analysis (0)] |
| 35. | Nakamura K, Ito I, Kobayashi M, Herndon DN, Suzuki F. Orosomucoid 1 drives opportunistic infections through the polarization of monocytes to the M2b phenotype. Cytokine. 2015;73:8-15. [PubMed] [DOI] [Cited in This Article: ] [Cited by in Crossref: 25] [Cited by in F6Publishing: 29] [Article Influence: 3.2] [Reference Citation Analysis (0)] |


