Published online Feb 28, 2011. doi: 10.3748/wjg.v17.i8.968
Revised: September 13, 2010
Accepted: September 20, 2010
Published online: February 28, 2011
AIM: To develop and validate a transient micro-elastography device to measure liver stiffness (LS) in mice.
METHODS: A novel transient micro-elastography (TME) device, dedicated to LS measurements in mice with a range of measurement from 1-170 kPa, was developed using an optimized vibration frequency of 300 Hz and a 2 mm piston. The novel probe was validated in a classical fibrosis model (CCl4) and in a transgenic murine model of systemic amyloidosis.
RESULTS: TME could be successfully performed in control mice below the xiphoid cartilage, with a mean LS of 4.4 ± 1.3 kPa, a mean success rate of 88%, and an excellent intra-observer agreement (0.98). Treatment with CCl4 over seven weeks drastically increased LS as compared to controls (18.2 ± 3.7 kPa vs 3.6 ± 1.2 kPa). Moreover, fibrosis stage was highly correlated with LS (Spearman coefficient = 0.88, P < 0.01). In the amyloidosis model, much higher LS values were obtained, reaching maximum values of > 150 kPa. LS significantly correlated with the amyloidosis index (0.93, P < 0.0001) and the plasma concentration of mutant hapoA-II (0.62, P < 0.005).
CONCLUSION: Here, we have established the first non-invasive approach to measure LS in mice, and have successfully validated it in two murine models of high LS.
- Citation: Bastard C, Bosisio MR, Chabert M, Kalopissis AD, Mahrouf-Yorgov M, Gilgenkrantz H, Mueller S, Sandrin L. Transient micro-elastography: A novel non-invasive approach to measure liver stiffness in mice. World J Gastroenterol 2011; 17(8): 968-975
- URL: https://www.wjgnet.com/1007-9327/full/v17/i8/968.htm
- DOI: https://dx.doi.org/10.3748/wjg.v17.i8.968
Transient elastography (TE) (FibroScan®) is a novel non-invasive bedside method to assess liver fibrosis via liver stiffness (LS)[1,2]. In various liver diseases, LS was shown to be strongly associated with the degree of liver fibrosis[2-8]. In these studies, cut-off values have been defined that allow the diagnosis of advanced fibrosis (F3/4). Despite some variability, cut-off values of 8.0 and 12.5 kPa are widely accepted to identify patients with F3 and F4 fibrosis, respectively. Although LS closely correlates with fibrosis stage, it also increases in patients with mild[9,10] or acute hepatitis[11], cholestasis[12], and liver congestion[13], independently of the degree of fibrosis. Thus, improved diagnostic algorithms require the exclusion of congestion and mechanic cholestasis by ultrasound and measurement of liver function tests prior to LS interpretation[2].
Despite major efforts worldwide, the molecular mechanisms of liver fibrosis are still poorly understood[14]. The appreciation of LS as physical parameter has not only improved fibrosis diagnosis, but has also stimulated our understanding of its pathophysiology. Thus, LS seems to directly affect matrix synthesis[15] and precedes fibrosis progression[16]. Two recent reports have highlighted the importance of hydrostatic pressure on LS[12,13], leading to the formulation of the pressure-LS-fibrosis sequence hypothesis[2]. However, no non-invasive and routinely exploitable methods exist to assess LS in mice, which is the standard animal model for studying fibrosis[17] and antifibrotic strategies[18].
Elastographic techniques seem to be the most promising approach to assess tissue stiffness in vivo. Although magnetic resonance elastography (MRE)[19] has been successfully applied to quantify LS in rodents[20,21], this technique sometimes requires the insertion of a needle to transmit a vibration to the liver[20]. In addition, MRE techniques remain very expensive, limiting their routine use in animal laboratories. Likewise, alternative techniques, such as ultrasonic static elastography[22], are restricted to in vitro or in situ studies in mice[23], and they are not quantitative[24]. Recently, acoustic radiation force impulse (ARFI) imaging[25] has been successfully applied to quantify LS in a rat model of toxic liver fibrosis induced by carbon tetrachloride (CCl4) injections[26]. However, the probe had to be coupled to the rat’s abdomen through a water-path and a layer of saran wrap. Alternative approaches, such as elasticity and atomic force microscopy[15,27,28], yield stiffness values at the cellular level; however, how subcellular stiffness parameters translate into overall organ stiffness and fibrogenesis remains under discussion. Finally, a direct rheological technique only allows the measurement of LS on the explanted organ ex vivo[16].
Here, we introduce a novel miniaturized probe, based on the principle of vibration-controlled transient elastography. Significant changes in the physical parameters, such as vibration frequency, are required because of the small size of the murine liver. We demonstrate that the novel transient micro-elastography (TME) device reproducibly allows the measurement of LS in mice. We successfully validated the technique in two murine models of increased LS: the conventional CCl4-induced fibrosis model and a transgenic model of systemic amyloidosis.
A homogeneous copolymer-in-oil phantom, comprising Styrene-Ethylene-Butylene-Styrene (4%) and mineral oil, was used to compare the results obtained using TE and TME, as described recently[29].
Carbon tetrachloride fibrosis model: Toxic liver fibrosis was induced by carbon tetrachloride (CCl4) injections over seven weeks, according to standard protocols (Sigma Aldrich, St. Louis, MO, USA)[30]. Nine female CD1 mice were divided into three groups (Table 1): the first group (n = 3, aged 6 mo) received toxic injections (CCl4, 5 mL/kg dissolved in paraffin oil, ratio 1:10), the second group (n = 3, aged 16 mo) received paraffin oil, and the third group (n = 3, aged 4 mo) was not treated. Intraperitoneal injections of CCl4 or paraffin oil were performed twice a week over seven weeks. For LS measurements, mice were first anaesthetized with isoflurane (0.75%-1% in oxygen).
| Mouse | Strain | Type | Sex | Liver stiffness (kPa) | Success rate for LSM (%) | % sirius red |
| 1 | C57BL/6 | Control | M | 4.7 | 75 | ND |
| 2 | C57BL/6 | Control | M | 4.0 | 100 | ND |
| 3 | C57BL/6 | Control | M | 4.7 | 67 | ND |
| 4 | C57BL/6 | Control | M | 6.8 | 86 | ND |
| 5 | CD1 | Control | F | 5.0 | 100 | < 0.3 |
| 6 | CD1 | Control | F | 3.3 | 92 | 0.05 |
| 7 | CD1 | Control | F | 2.6 | 94 | 0.10 |
| 8 | CD1 | Oil injected | F | 5.3 | 100 | 0.42 |
| 9 | CD1 | Oil injected | F | 9.3 | 84 | 0.72 |
| 10 | CD1 | Oil injected | F | 5.8 | 91 | 0.32 |
| 11 | CD1 | CCl4 injected | F | 18.8 | 100 | 1.84 |
| 12 | CD1 | CCl4 injected | F | 21.6 | 100 | 2.36 |
| 14 | CD1 | CCl4 injected | F | 14.2 | 100 | 2.38 |
Mouse model of systemic amyloidosis: Transgenic mice with systemic amyloidosis were generated at the Cordeliers Research Center (UMRS 872, Paris, France) by microinjection of the 3-kilobase genomic clone of the human apolipoprotein A-II (hapoA-II) gene, bearing a stop codon serine mutation. In humans, this mutation results in a longer amyloidogenic protein[31]. Normal apolipoprotein A-II (apoA-II) is a major protein of high-density lipoproteins, and its plasma concentration is measured by immunonephelometry using a commercial kit (DiaSys, Holzheim, Germany). Three transgenic lines (Y, K and F) with very low, moderate, and high expression levels, respectively, of mutant hapoA-II were obtained (X. Rousset, M. Lacasa, A.D. Kalopissis and M. Chabert, manuscript in preparation). Twenty-seven transgenic mice (9 Y, 8 K, and 10 F), aged between 4 and 12 mo, were included in the study (Table 2). This group comprised 13 males and 14 females (Table 2). Furthermore, four male C57BL/6 mice aged 4 mo were kept as controls (Table 1). The animals were anesthetized by intraperitoneal injection of avertin (tribromoethanol, 2% solution), and LS measurements were performed. Mice were then sacrificed to evaluate the stage of amyloidosis. The livers of 19 mice were removed and weighed. Animal use procedures were in accordance with the recommendations of the European Economic Community (86/609/CEE) and the French National Committee (decree 87/848) for the care and use of laboratory animals.
| Mouse | Strain | Sex | Liver weight to body weight ratio (%) | hapoA-II (g/L) | Amyloidosis index | LS (kPa) | Success rate for LSM (%) |
| 1 | Y | F | 5.1 | 0.19 | 0 | 3.9 | 90 |
| 2 | Y | M | ND | ND | 0 | 9.3 | 83 |
| 3 | Y | F | ND | ND | 0 | 5.9 | 100 |
| 4 | Y | F | 4.4 | 0.22 | 0 | 4.1 | 100 |
| 5 | Y | F | 4.5 | 0.22 | 0 | 4.1 | 100 |
| 6 | Y | F | 4.6 | ND | 0 | 4.7 | 86 |
| 7 | Y | F | ND | ND | 1 | 12.6 | 100 |
| 8 | Y | M | 5.2 | 0.23 | 0 | 3.9 | 100 |
| 9 | Y | F | ND | ND | 0 | 11.2 | 92 |
| 10 | K | M | ND | 0.15 | 1 | 23.7 | 100 |
| 11 | K | M | 16.0 | 0.55 | 4 | 124.0 | 74 |
| 12 | K | M | 13.8 | 0.57 | 2 | 124.0 | 57 |
| 13 | K | F | 15.8 | 0.54 | 4 | 168.8 | 100 |
| 14 | K | F | 22.8 | 0.80 | 3 | 168.8 | 82 |
| 15 | K | F | 18.2 | 0.44 | 3 | 168.8 | 100 |
| 16 | K | F | 12.1 | 0.42 | 2 | 94.9 | 100 |
| 17 | K | F | 5.0 | 0.28 | 0 | 4.4 | 96 |
| 18 | F | M | 7.6 | 0.66 | 1 | 50.2 | 100 |
| 19 | F | M | ND | 0.76 | 1 | 73.0 | 100 |
| 20 | F | M | ND | 0.44 | 1 | 13.5 | 92 |
| 21 | F | F | 12.9 | ND | 2 | 124.0 | 95 |
| 22 | F | M | ND | 0.35 | 2 | 155.5 | 100 |
| 23 | F | F | 16.3 | 0.58 | 3 | 168.8 | 95 |
| 24 | F | M | 15.7 | 0.53 | 3 | 168.8 | 69 |
| 25 | F | M | 14.9 | 0.59 | 3 | 168.8 | 100 |
| 26 | F | M | 13.7 | 0.64 | 3 | 124.0 | 89 |
| 27 | F | M | 10.8 | 0.59 | 3 | 168.8 | 100 |
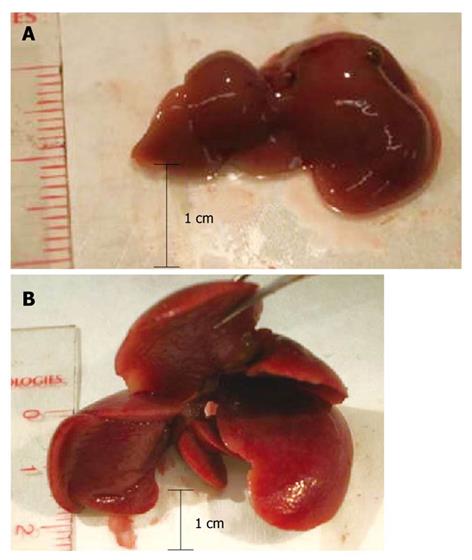
To determine the stage of amyloidosis, mice were sacrificed and their livers were subjected to macroscopic examination. Several parameters were considered, including the size of the liver, its apparent rigidity, and modifications of the lobes, such as hypertrophy, and included in an empirically established score from 0 to 4 (Table 3). Representative livers of a normal mouse and an amyloidosis mouse stage 3 are shown in Figure 1. All examinations were performed by M.C. in a blinded fashion, without knowledge of the TME data.
| Index | Liver appearance |
| 0 | Normal |
| 1 | Slightly bigger and/or stiffer |
| 2 | Big and stiff (± whitish zones) |
| 3 | Very big and stiff, changes in the right lobe (± whitish zones) |
| 4 | Very big and stiff, right lobe transformed and very big (± whitish zones) |
Immediately after stiffness measurements, transgenic mice with amyloidosis were sacrificed for histological analysis. Their livers were quickly removed after intra-cardiac vascular washing with 0.1 mol/L phosphate buffer and then with 4% paraformaldehyde (PFA). The livers were then cut and immersion-fixed, successively, in 4% PFA and then in sucrose overnight. Small livers pieces were embedded in Tissue-Tek O.C.T. compound 4583 (Sakura Finetek, Torrance, CA, USA), frozen and stored at -80°C until analysis. Tissue sections of 20 μm were specifically stained for amyloidosis with Congo red. Amyloid fibrils consisted solely of hapoA-II; therefore, 5 μm thick liver sections were immunostained with a hapoA-II specific antibody and examined with an LSM-710 laser scanning confocal microscope (Carl Zeiss, Inc., Thornwood, NY, USA).
Livers of mice with toxic liver fibrosis were harvested, fixed in 4% neutral-buffered formalin, and embedded in paraffin. 5 μm thick sections were stained with hematoxylin and eosin (HE) or with picrosirius red (Sigma Aldrich, St. Louis, MO, USA), as previously described[32]. For morphometric analysis, 15 images per animal from at least two different lobes were taken at × 100 magnification. The areas of staining were quantitated using the software Image J 1.37v (National Institutes of Health, Bethesda, MD, USA). The histological results provided by the analysis of these 15 images are more reliable and representative than a mere biopsy.
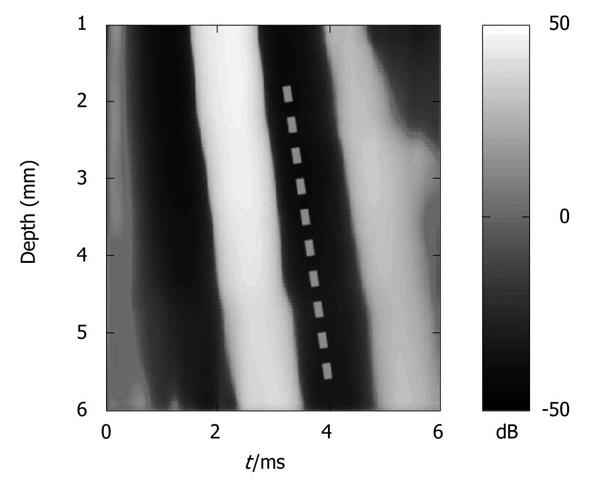
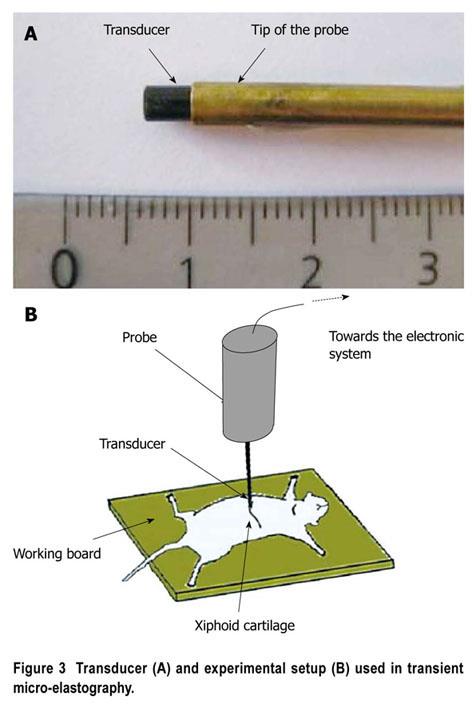
TE measures shear wave velocity, and thus determines tissue stiffness using ultrasound to follow the propagation of a low frequency shear wave generated in a tissue by an external vibrator[33,34]. In humans, TE uses a low frequency vibration of 50 Hz generated by an ultrasonic transducer 9 mm in diameter used as a piston. However, shear stiffness can be overestimated in the near field zone (i.e. under 25 mm for a 50 Hz excitation) because of diffraction effects[35]. Due to the morphology of mice, measurements have to be performed very close to the vibration source, where diffraction effects are likely to occur. Our modified TME device allows the measurement of elasticity near the probe and is suitable for contact measurements of stiffness at the organ surface. TME comprises a microprobe, a high frequency electronic system (Echosens, Paris, France), and a laptop computer to control the ultrasound system and analyze the data. The microprobe contains an ultrasonic transducer (Imasonic, Besançon, France), used as both the receiver and emitter, which is mounted on a mechanical vibrator to generate a low frequency shear wave. The electronic system is fully programmable, and enables sampling of the radiofrequency data at a frequency up to 200 MHz with a 12-bit precision. Diffraction effects were reduced by increasing the frequency of vibration to 300 Hz and reducing the diameter of the piston (2 mm). To improve the performance of TME in mice, we also increased the ultrasound frequency (up to 12 MHz). These parameters allowed the calculation of displacements with better resolution. During the propagation of the low frequency shear wave, the radiofrequency (RF) data were acquired at a repetition frequency of 15000 Hz. The displacements induced in the medium were computed from the RF data using an autocorrelation method and derived vs depth to provide a strain image (Figure 2). Analysis of the strain image yields the shear wave velocity and thus elasticity, according to the formula E = 3ρVs² where E, ρ (1 kg/dm3), and Vs are the Young’s modulus, the mass density, and the shear wave velocity, respectively. To compute the shear wave velocity, we used a time-of-flight algorithm, as previously described by Sandrin et al[1]. The system enables the measurement of stiffness values (Young’s modulus) between 0.5 kPa and 170 kPa. However, for high stiffness values (> 100 kPa), the computational step is larger and the measurement less accurate.
Anesthetized mice were placed in the spinal position. Abdominal hair was removed and gel was used to ensure the coupling. The best location for LS measurement was below the level of the xiphoid cartilage (Figure 3). We identified some conditions that could limit successful TME measurements (very small mice, or mice with highly hypertrophic and misshapen livers, as in advanced amyloidosis). Measurements were routinely performed in the median liver lobe, between 2 mm and 5-6 mm below the skin surface, depending on the size of the animal. For each LS value, we performed at least 10 validated measurements, and used the median of the values recorded. The approximate duration of the examination was generally five minutes.
The relationship between LS and histology was investigated by computing p-values for the Spearman coefficient, and using Kruskal-Wallis nonparametric one-way analysis of variance (ANOVA) and one-sided Mann-Whitney tests. These nonparametric tests are particularly well suited to analyze data from small samples. Correlations with p-values less than 0.05 were considered significant. Bar plots were also used to estimate the stiffness distribution as a function of amyloidosis index. Intra-observer agreement was analyzed using the intraclass correlation coefficient (ICC). All statistical analyses were carried out using Matlab (The MathWorks, Natick, MA, USA).
A homogenous copolymer-in-oil phantom with a defined stiffness was used to establish and compare TME with TE. In TE, the Young’s modulus was measured in a region of interest (ROI) located between 25 and 65 mm from the source, whereas with TME, the ROI was located between 2 and 6 mm. TME yielded a slightly higher, but comparable, Young’s modulus of 9.9 ± 0.3 kPa as compared to TE (8.2 ± 0.0 kPa). To evaluate the intra-observer agreement, we performed two consecutive series of 10 valid measurements in seven control mice (Table 1) and twelve transgenic mice exhibiting different amyloidosis stages (Table 2). Then, we computed the ICC, which was 0.98. In healthy control mice (n = 7), mean LS was comparable to human LS, at 4.4 ± 1.3 kPa. The mean success rate was 88%. Thus, we concluded that, using a vibration frequency of 300 Hz, TME allows for non-invasive and reproducible measurements of LS in mice over a wider stiffness range.
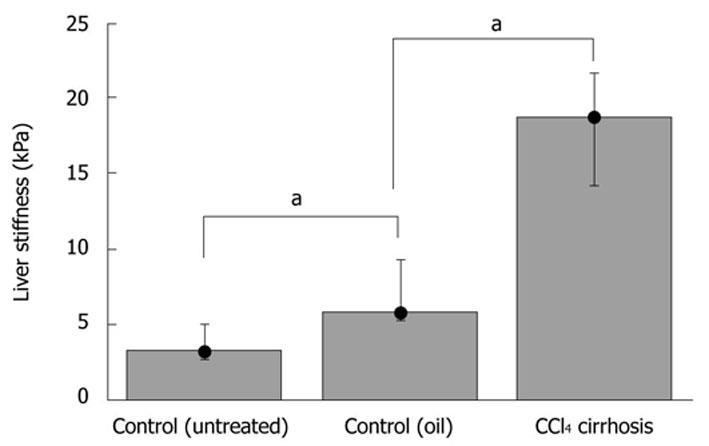
We next studied LS in a conventional fibrosis model using CCl4 injections over seven weeks. Two controls were used (paraffin oil without CCl4 and untreated controls). Fibrosis was assessed by picrosirius red staining, and stained areas were quantified (Table 1). As expected, fibrotic scars were only detected within the parenchyma of the CCl4-treated mice, forming bridges between vessels with a very faint inflammatory reaction (not shown). TME showed a significantly higher LS (P-value ≤ 0.05) in the experimental CCl4-treated group (E = 18.2 ± 3.7 kPa) compared to oil-injected mice (E = 6.8 ± 2.2 kPa) or control mice (E = 3.6 ± 1.2 kPa) (Figure 4). A high correlation was also obtained between LS and CCl4-induced liver fibrosis, as assessed by picrosirius red staining (Spearman coefficient = 0.88, P < 0.01).
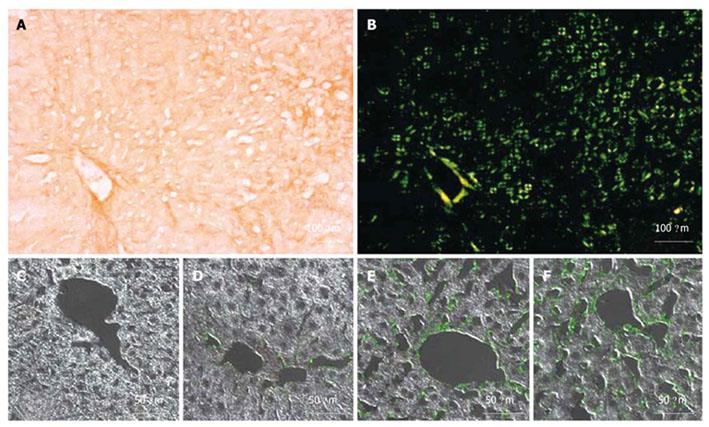
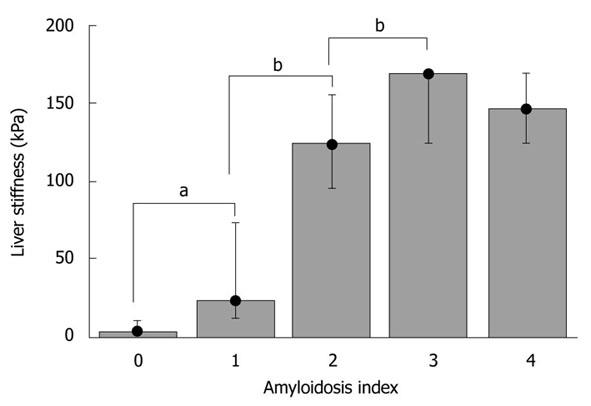
Hepatic amyloidosis is known to cause increased LS in humans[36,37]. We therefore studied LS in a recently established murine amyloidosis model using TME. Amyloid deposits were detected in the livers of 6-mo-old transgenic mice by green birefringence in Congo red stained sections under a polarized microscope (Figure 5A and B). Figures 5C-F display liver sections immunostained with a specific anti-hapoA-II antibody (green fluorescence in confocal microscopy) detecting mutant hapoA-II forming amyloid fibrils. Amyloidosis was absent in a control C57BL/6 mouse (Figure 5C), and drastically increased in transgenic mice as a function of age (Figure 5D-F). Figure 6 shows bar plots of LS as a function of amyloidosis index. LS significantly correlated with the amyloidosis index established by macroscopic examination (Spearman coefficient = 0.93, P-value < 0.0001). Interestingly, significant differences in LS were observed between degrees of amyloidosis, and TME was able to clearly discriminate between amyloidosis indexes 0 and 1 (P-value < 0.005). Mice with amyloidosis indexes 3 and 4 exhibited very high stiffness values, very close to the upper detection limit of 170 kPa (Table 2); thus explaining the lack of discrimination between these two indexes by LS measurements. We also found a significant correlation between LS and the ratio of liver weight to body weight (Spearman coefficient = 0.84, P-value < 0.0001), which increases with the progression of the disease because of the progressive deposition of amyloid fibrils in the liver. In addition, the plasma concentration of mutant hapoA-II partly accounts for LS values (Spearman coefficient = 0.62, P-value < 0.005).
We here introduce TME for the assessment of LS in mice in a rapid and non-invasive manner. In addition, we successfully studied LS and validated TME in two mouse models with increased LS. With a success rate of 88% and an intra-observer variability of 0.98, TME offers the first approach to study LS in small animal models, a prerequisite condition for determining the role of LS in murine fibrosis models.
Interestingly, LS values of control mice (4.4 ± 1.3 kPa) were comparable to those of healthy humans, which should be below 6 kPa[2]. These LS values are also consistent with those found in rodents using other techniques such as MRE or ARFI[20,21,26]. These findings emphasize that normal LS seems to be below 6 kPa, which is independent of liver size.
The investigation performed on mice with CCl4-induced fibrosis showed the potential of TME for fibrosis quantification in mice. After seven weeks of fibrosis induction, LS had increased to 18.2 ± 3.7 kPa in all livers with a proven cirrhosis stage. Thus, murine LS had clearly passed typical cut-off values for F4 cirrhosis (12.5 kPa). The increase of LS in the CCl4 model was also in good agreement with the recently reported storage shear modulus determined on explanted non-perfused livers[16]. Previous MRE and ARFI studies reported much smaller LS values for fibrotic livers, using either CCl4-induced fibrosis or knock-out models[20,21,26]. However, the degree of fibrosis is known to vary considerably in the CCl4 fibrosis model and significantly depends on the species used. Thus, LS of 5.4 and 6.9 kPa have been reported recently in CCl4 rat models[21,26], with a very small difference between control and treatment groups of less than 1.5 kPa. We observed a slightly higher LS in the control mice treated with the CCl4 carrier solvent paraffin oil (6.8 ± 2.2 kPa), as compared to untreated mice (3.6 ± 1.2 kPa). This was most likely due to the older age (12 mo) of the oil-injected group: age has been recognized as factor that independently increases LS in humans[38,39].
It has been recently demonstrated in humans that hepatic amyloidosis can drastically increase LS up to the detection limit of TE[36,37]. Here, we reproduced these data in a transgenic murine model of amyloidosis using TME and showed significant correlation between histological and serum markers of amyloidosis. Thus, in contrast to visual assessment and manual palpation, TME allowed the detection of the early stage 1 of the disease. LS also significantly correlated with the amyloidosis index and plasma concentrations of mutant hapoA-II. Comparable to humans, amyloidosis showed the highest LS values reported so far in rodents, significantly exceeding 75 kPa.
In conclusion, TME allows the measurement of LS in mice in a fast, reproducible, and non-invasive manner. TME will be a powerful tool for studying fibrosis in murine models, and in transgenic and knock out mice in longitudinal studies. It will help in the better understanding of the determinants of LS, such as venous pressure[13] or extrahepatic cholestasis[12]. Finally, TME will also permit the exploration of anti-fibrotic strategies.
Transient elastography is a quantitative ultrasound elastography technique, which consists of following with ultrasound the propagation of a low frequency shear wave generated in a tissue by an external vibrator. Based on transient elastography, Fibroscan® (Echosens, Paris, France) is a novel non-invasive bedside method to assess liver fibrosis by measuring liver stiffness. This technique provides an average value of the Young’s modulus in a region of interest, comprising an area between 25 and 65 mm below the skin. This device is non-invasive, fully automatic, and generates a result within a few minutes. Its main advantages are its ease of use, good reproducibility, and very good acceptance by patients. Clinical interest in liver stiffness measurement using Fibroscan® has been largely validated for adult patients with chronic liver diseases.
Over the past decades, the mouse has emerged as one of the best model organisms for experimental studies of human diseases and drug testing. For example, in liver pathologies, mice have been used in numerous investigations involving antifibrogenic substances. However, no non-invasive and routinely exploitable methods exist to assess liver stiffness in mice.
In the area of small animal experimentation, the use of elastographic techniques has been reported by several groups with magnetic resonance elastography (MRE) and static ultrasound elastography. However, the techniques proposed remain expensive (MRE) and are sometimes invasive and unsuitable forin vivoapplications. The use of elastographic techniques on small animals is therefore a challenging area of investigation.
In this study, a novel transient micro-elastography (TME) device dedicated to liver stiffness (LS) measurements in mice was developed. The novel system was validated in both a classical fibrosis model (CCl4) and a transgenic murine model of systemic amyloidosis. TME could be successfully performed in control mice below the xiphoid cartilage, with a mean LS of 4.4 ± 1.3 kPa, a mean success rate of 88%, and an excellent intra-observer agreement (0.98). Treatment with CCl4 over seven weeks drastically increased LS as compared to controls (18.2 ± 3.7 kPavs3.6 ± 1.2 kPa). Moreover, fibrosis stage highly correlated with LS (Spearman coefficient = 0.88,P< 0.01). In the amyloidosis model, much higher LS values were obtained, reaching maximum values of > 150 kPa. LS significantly correlated with the amyloidosis index (0.93,P< 0.0001) and the plasma concentration of mutant hapoA-II (0.62,P< 0.005). Transient micro-elastography should make it possible to measure the evolution of pathologies such as fibrosis, in the same animal during longitudinal studies. Thus, TME could be a valuable non-invasive tool to assess the evolution of disease as a function of time and the response to treatment of fibrosis inin vivomurine models without proceeding to euthanasia.
Elastography is a technique used to measure the elasticity of biological tissues. It has been introduced as a novel diagnostic tool in oncology and hepatology. Amyloidoses are a group of β-structure protein deposition diseases. Liver, kidney, spleen, heart, joints, muscles, and gastrointestinal tract are usually involved in the systemic forms of amyloidosis.
This study is of interest because it introduces a method for successfully measuring liver stiffness in mice. Unlike previous methods, this method is noninvasive and quantitative. The method is illustrated in a model of CCl4 induced liver fibrosis and also in an amyloidosis model.
Peer reviewer: Dr. Joseph J Cullen, MD, Professor, Department of Surgery, University of Iowa Carver College of Medicine, 4605 JCP, University of Iowa Hospitals and Clinics, 200 Hawkins Drive, Iowa City, IA 52242, United States
S- Editor Sun H L- Editor Stewart GJ E- Editor Ma WH
| 1. | Sandrin L, Fourquet B, Hasquenoph JM, Yon S, Fournier C, Mal F, Christidis C, Ziol M, Poulet B, Kazemi F. Transient elastography: a new noninvasive method for assessment of hepatic fibrosis. Ultrasound Med Biol. 2003;29:1705-1713. [Cited in This Article: ] |
| 2. | Mueller S, Sandrin L. Liver stiffness: a novel parameter for the diagnosis of liver disease. Hepatic Med: Evid and Res. 2010;2:49-67. [Cited in This Article: ] |
| 3. | Erhardt A, Lörke J, Vogt C, Poremba C, Willers R, Sagir A, Häussinger D. [Transient elastography for diagnosing liver cirrhosis]. Dtsch Med Wochenschr. 2006;131:2765-2769. [Cited in This Article: ] |
| 4. | Castéra L, Vergniol J, Foucher J, Le Bail B, Chanteloup E, Haaser M, Darriet M, Couzigou P, De Lédinghen V. Prospective comparison of transient elastography, Fibrotest, APRI, and liver biopsy for the assessment of fibrosis in chronic hepatitis C. Gastroenterology. 2005;128:343-350. [Cited in This Article: ] |
| 5. | Ganne-Carrié N, Ziol M, de Ledinghen V, Douvin C, Marcellin P, Castera L, Dhumeaux D, Trinchet JC, Beaugrand M. Accuracy of liver stiffness measurement for the diagnosis of cirrhosis in patients with chronic liver diseases. Hepatology. 2006;44:1511-1517. [Cited in This Article: ] |
| 6. | Friedrich-Rust M, Ong MF, Martens S, Sarrazin C, Bojunga J, Zeuzem S, Herrmann E. Performance of transient elastography for the staging of liver fibrosis: a meta-analysis. Gastroenterology. 2008;134:960-974. [Cited in This Article: ] |
| 7. | Nguyen-Khac E, Chatelain D, Tramier B, Decrombecque C, Robert B, Joly JP, Brevet M, Grignon P, Lion S, Le Page L. Assessment of asymptomatic liver fibrosis in alcoholic patients using fibroscan: prospective comparison with seven non-invasive laboratory tests. Aliment Pharmacol Ther. 2008;28:1188-1198. [Cited in This Article: ] |
| 8. | Nahon P, Kettaneh A, Tengher-Barna I, Ziol M, de Lédinghen V, Douvin C, Marcellin P, Ganne-Carrié N, Trinchet JC, Beaugrand M. Assessment of liver fibrosis using transient elastography in patients with alcoholic liver disease. J Hepatol. 2008;49:1062-1068. [Cited in This Article: ] |
| 9. | Coco B, Oliveri F, Maina AM, Ciccorossi P, Sacco R, Colombatto P, Bonino F, Brunetto MR. Transient elastography: a new surrogate marker of liver fibrosis influenced by major changes of transaminases. J Viral Hepat. 2007;14:360-369. [Cited in This Article: ] |
| 10. | Arena U, Vizzutti F, Corti G, Ambu S, Stasi C, Bresci S, Moscarella S, Boddi V, Petrarca A, Laffi G. Acute viral hepatitis increases liver stiffness values measured by transient elastography. Hepatology. 2008;47:380-384. [Cited in This Article: ] |
| 11. | Sagir A, Erhardt A, Schmitt M, Häussinger D. Transient elastography is unreliable for detection of cirrhosis in patients with acute liver damage. Hepatology. 2008;47:592-595. [Cited in This Article: ] |
| 12. | Millonig G, Reimann FM, Friedrich S, Fonouni H, Mehrabi A, Büchler MW, Seitz HK, Mueller S. Extrahepatic cholestasis increases liver stiffness (FibroScan) irrespective of fibrosis. Hepatology. 2008;48:1718-1723. [Cited in This Article: ] |
| 13. | Millonig G, Friedrich S, Adolf S, Fonouni H, Golriz M, Mehrabi A, Stiefel P, Pöschl G, Büchler MW, Seitz HK. Liver stiffness is directly influenced by central venous pressure. J Hepatol. 2010;52:206-210. [Cited in This Article: ] |
| 14. | Bataller R, Brenner DA. Liver fibrosis. J Clin Invest. 2005;115:209-218. [Cited in This Article: ] |
| 15. | Hinz B. The myofibroblast: paradigm for a mechanically active cell. J Biomech. 2010;43:146-155. [Cited in This Article: ] |
| 16. | Georges PC, Hui JJ, Gombos Z, McCormick ME, Wang AY, Uemura M, Mick R, Janmey PA, Furth EE, Wells RG. Increased stiffness of the rat liver precedes matrix deposition: implications for fibrosis. Am J Physiol Gastrointest Liver Physiol. 2007;293:G1147-G1154. [Cited in This Article: ] |
| 17. | Rosenthal N, Brown S. The mouse ascending: perspectives for human-disease models. Nat Cell Biol. 2007;9:993-999. [Cited in This Article: ] |
| 18. | Wasmuth HE, Lammert F, Zaldivar MM, Weiskirchen R, Hellerbrand C, Scholten D, Berres ML, Zimmermann H, Streetz KL, Tacke F. Antifibrotic effects of CXCL9 and its receptor CXCR3 in livers of mice and humans. Gastroenterology. 2009;137:309-319, 319.e1-3. [Cited in This Article: ] |
| 19. | Manduca A, Oliphant TE, Dresner MA, Mahowald JL, Kruse SA, Amromin E, Felmlee JP, Greenleaf JF, Ehman RL. Magnetic resonance elastography: non-invasive mapping of tissue elasticity. Med Image Anal. 2001;5:237-254. [Cited in This Article: ] |
| 20. | Yin M, Woollard J, Wang X, Torres VE, Harris PC, Ward CJ, Glaser KJ, Manduca A, Ehman RL. Quantitative assessment of hepatic fibrosis in an animal model with magnetic resonance elastography. Magn Reson Med. 2007;58:346-353. [Cited in This Article: ] |
| 21. | Salameh N, Peeters F, Sinkus R, Abarca-Quinones J, Annet L, Ter Beek LC, Leclercq I, Van Beers BE. Hepatic viscoelastic parameters measured with MR elastography: correlations with quantitative analysis of liver fibrosis in the rat. J Magn Reson Imaging. 2007;26:956-962. [Cited in This Article: ] |
| 22. | Ophir J, Céspedes I, Ponnekanti H, Yazdi Y, Li X. Elastography: a quantitative method for imaging the elasticity of biological tissues. Ultrason Imaging. 1991;13:111-134. [Cited in This Article: ] |
| 23. | Bilgen M, Srinivasan S, Lachman LB, Ophir J. Elastography imaging of small animal oncology models: a feasibility study. Ultrasound Med Biol. 2003;29:1291-1296. [Cited in This Article: ] |
| 24. | Kim K, Johnson LA, Jia C, Joyce JC, Rangwalla S, Higgins PD, Rubin JM. Noninvasive ultrasound elasticity imaging (UEI) of Crohn's disease: animal model. Ultrasound Med Biol. 2008;34:902-912. [Cited in This Article: ] |
| 25. | Nightingale K, Soo MS, Nightingale R, Trahey G. Acoustic radiation force impulse imaging: in vivo demonstration of clinical feasibility. Ultrasound Med Biol. 2002;28:227-235. [Cited in This Article: ] |
| 26. | Wang MH, Palmeri ML, Guy CD, Yang L, Hedlund LW, Diehl AM, Nightingale KR. In vivo quantification of liver stiffness in a rat model of hepatic fibrosis with acoustic radiation force. Ultrasound Med Biol. 2009;35:1709-1721. [Cited in This Article: ] |
| 27. | Cohn NA, Emelianov SY, Lubinski MA, O'Donnell M. An elasticity microscope. Part I: Methods. IEEE Trans Ultrason Ferroelectr Freq Control. 1997;44:1304-1319. [Cited in This Article: ] |
| 28. | Cohn NA, Emelianov SY, O'Donnell M. An elasticity microscope. Part II: Experimental results. IEEE Trans Ultrason Ferroelectr Freq Control. 1997;44:1320-1331. [Cited in This Article: ] |
| 29. | Oudry J, Bastard C, Miette V, Willinger R, Sandrin L. Copolymer-in-oil phantom materials for elastography. Ultrasound Med Biol. 2009;35:1185-1197. [Cited in This Article: ] |
| 30. | Abraldes JG, Pasarín M, García-Pagán JC. Animal models of portal hypertension. World J Gastroenterol. 2006;12:6577-6584. [Cited in This Article: ] |
| 31. | Benson MD, Liepnieks JJ, Yazaki M, Yamashita T, Hamidi Asl K, Guenther B, Kluve-Beckerman B. A new human hereditary amyloidosis: the result of a stop-codon mutation in the apolipoprotein AII gene. Genomics. 2001;72:272-277. [Cited in This Article: ] |
| 32. | Mitchell C, Couton D, Couty JP, Anson M, Crain AM, Bizet V, Rénia L, Pol S, Mallet V, Gilgenkrantz H. Dual role of CCR2 in the constitution and the resolution of liver fibrosis in mice. Am J Pathol. 2009;174:1766-1775. [Cited in This Article: ] |
| 33. | Sandrin L, Tanter M, Gennisson JL, Catheline S, Fink M. Shear elasticity probe for soft tissues with 1-D transient elastography. IEEE Trans Ultrason Ferroelectr Freq Control. 2002;49:436-446. [Cited in This Article: ] |
| 34. | Ziol M, Handra-Luca A, Kettaneh A, Christidis C, Mal F, Kazemi F, de Lédinghen V, Marcellin P, Dhumeaux D, Trinchet JC. Noninvasive assessment of liver fibrosis by measurement of stiffness in patients with chronic hepatitis C. Hepatology. 2005;41:48-54. [Cited in This Article: ] |
| 35. | Sandrin L, Cassereau D, Fink M. The role of the coupling term in transient elastography. J Acoust Soc Am. 2004;115:73-83. [Cited in This Article: ] |
| 36. | Janssens E, Spahr L, Rubbia-Brandt L, Giostra E, Bihl F. Hepatic amyloidosis increases liver stiffness measured by transient elastography. Acta Gastroenterol Belg. 2010;73:52-54. [Cited in This Article: ] |
| 37. | Lanzi A, Gianstefani A, Mirarchi MG, Pini P, Conti F, Bolondi L. Liver AL amyloidosis as a possible cause of high liver stiffness values. Eur J Gastroenterol Hepatol. 2010;22:895-897. [Cited in This Article: ] |
| 38. | Wong GL, Wong VW, Choi PC, Chan AW, Chim AM, Yiu KK, Chan HY, Chan FK, Sung JJ, Chan HL. Metabolic syndrome increases the risk of liver cirrhosis in chronic hepatitis B. Gut. 2009;58:111-117. [Cited in This Article: ] |
| 39. | Pineda JA, González J, Ortega E, Tural C, Macías J, Griffa L, Burgos A. Prevalence and factors associated with significant liver fibrosis assessed by transient elastometry in HIV/hepatitis C virus-coinfected patients. J Viral Hepat. 2010;17:714-719. [Cited in This Article: ] |


