Copyright
©2009 The WJG Press and Baishideng.
World J Gastroenterol. Jul 28, 2009; 15(28): 3480-3485
Published online Jul 28, 2009. doi: 10.3748/wjg.15.3480
Published online Jul 28, 2009. doi: 10.3748/wjg.15.3480
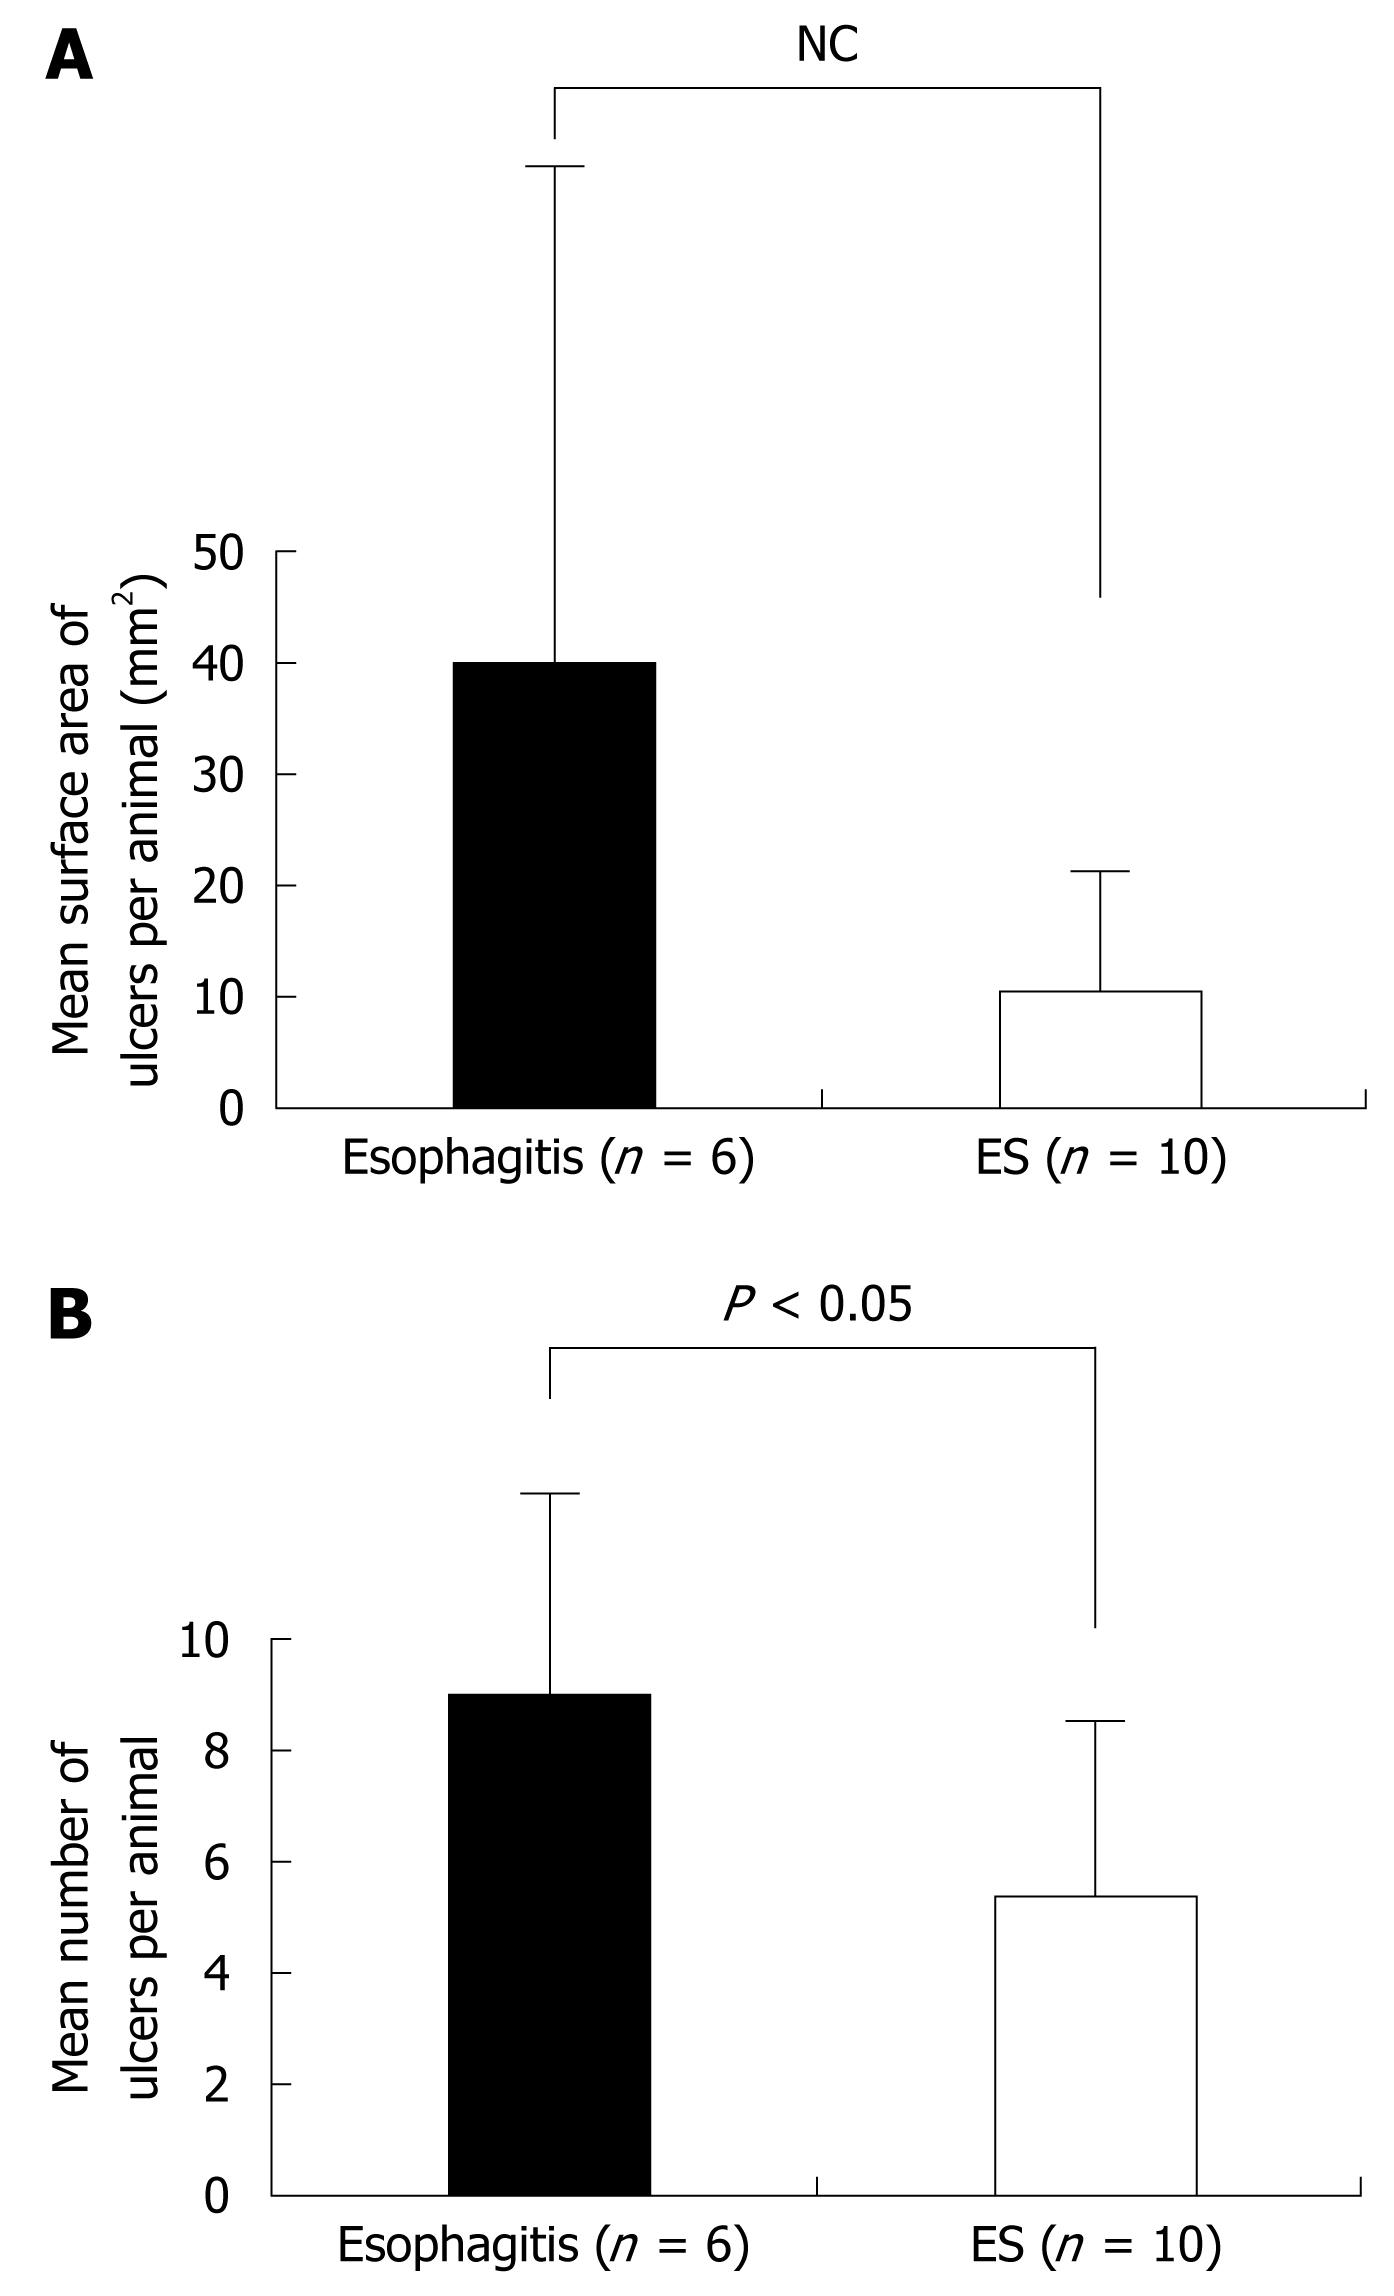
Figure 2 Mean surface area and number of ulcers per animal.
A: Mean surface area of ulcers per animal in the esophagitis and ES groups. There were no significant differences in the mean area of ulcers between the two groups; B: Mean number of ulcers per animal in the esophagitis and ES groups. In the ES group, the number of ulcers was significantly less than in the esophagitis group (5.4 ± 2.5 vs 9.0 ± 3.5, P < 0.05).
- Citation: Asaoka D, Nagahara A, Oguro M, Izumi Y, Kurosawa A, Osada T, Kawabe M, Hojo M, Otaka M, Watanabe S. Characteristic pathological findings and effects of ecabet sodium in rat reflux esophagitis. World J Gastroenterol 2009; 15(28): 3480-3485
- URL: https://www.wjgnet.com/1007-9327/full/v15/i28/3480.htm
- DOI: https://dx.doi.org/10.3748/wjg.15.3480


