Editorial Open Access
Copyright ©2006 Baishideng Publishing Group Co., Limited. All rights reserved.
World J Gastroenterol. May 21, 2006; 12(19): 2969-2978
Published online May 21, 2006. doi: 10.3748/wjg.v12.i19.2969
Current and future applications of magnetic resonance imaging and spectroscopy of the brain in hepatic encephalopathy
VP Bob Grover, Daniel M Forton, Nayna Patel, Howard C Thomas, Simon D Taylor-Robinson, Hepatology Section, Division of Medicine A, St Mary’s Campus, Faculty of Medicine, Imperial College London, South Wharf Street, London W2 1NY, United Kingdom
VP Bob Grover, Nayna Patel, Simon D Taylor-Robinson, M Alex Dresner, Serena Counsell, David J Larkman, Imaging Sciences Department, Clinical Sciences Division, Faculty of Medicine, Imperial College London, Hammersmith Hospital, Du Cane Road, London W12 0HS, United Kingdom
Author contributions: All authors contributed equally to the work
Supported by grants from BUPA, the Royal College of Physicians of London and Paddington Charitable Trust, St Mary’s, London. The European Association for the Study of the Liver, the British Medical Research Council (G9900178), Philips Medical Systems (Cleveland, Ohio, USA) and the United Kingdom Department of Health provided support for some of the studies outlined
Correspondence to: Dr. VPB Grover, Robert Steiner MRI Unit, Imaging Sciences Department, Clinical Sciences Division, Faculty of Medicine, Imperial College London, Hammersmith Hospital, Du Cane Road, London W12 0HS, United Kingdom. bob.grover@imperial.ac.uk
Telephone: +44-208-3831510 Fax: +44-208-3833038
Received: December 3, 2005
Revised: January 7, 2005
Accepted: January 14, 2006
Published online: May 21, 2006

Abstract

Hepatic encephalopathy (HE) is a common neuro-psychiatric abnormality, which complicates the course of patients with liver disease and results from hepatocellular failure and/or portosystemic shunting. The manifestations of HE are widely variable and involve a spectrum from mild subclinical disturbance to deep coma. Research interest has focused on the role of circulating gut-derived toxins, particularly ammonia, the development of brain swelling and changes in cerebral neurotransmitter systems that lead to global CNS depression and disordered function. Until recently the direct investigation of cerebral function has been difficult in man. However, new magnetic resonance imaging (MRI) techniques provide a non-invasive means of assessment of changes in brain volume (coregistered MRI) and impaired brain function (fMRI), while proton magnetic resonance spectroscopy (1H MRS) detects changes in brain biochemistry, including direct measurement of cerebral osmolytes, such as myoinositol, glutamate and glutamine which govern processes intrinsic to cellular homeostasis, including the accumulation of intracellular water. The concentrations of these intracellular osmolytes alter with hyperammonaemia. MRS-detected metabolite abnormalities correlate with the severity of neuropsychiatric impairment and since MR spectra return towards normal after treatment, the technique may be of use in objective patient monitoring and in assessing the effectiveness of various treatment regimens.

Key Words: Hepatic encephalopathy, Magnetic resonance imaging, Magnetic resonance spectroscopy, Diffusion weighted imaging, Arterial spin labeling, Functional MRI


INTRODUCTION

Although the phenomenon of mental disturbance in patients with disordered liver function was probably first described over 2000 years ago by Hippocrates, the precise mechanisms associated with the development of hepatic encephalopathy (HE) remain unclear. The syndrome occurs in two distinct forms: in the context of acute liver failure, acute HE results in impaired consciousness which may progress to coma and death over a period of hours or days, whereas chronic HE describes the neuropsychiatric syndrome, most commonly associated with hepatic dysfunction and portosystemic shunting in cirrhosis. This may also exist in patients with surgical portosystemic shunts[1]. In most patients the condition is “minimal” and, on a functional basis, it is discernible in prolongation of reaction times in the activities of daily living, such as driving and operating machinery, but in about 30% of patients with chronic liver disease, the syndrome is more severe with alterations in behavior, mood, personality and disturbances in consciousness[1].

In routine clinical practice, brain imaging in the form of a CT scan has been commonly used to exclude other diagnoses, such as subdural hematomata, which may also cause impaired consciousness in patients with chronic liver disease. Until recently, the use of other imaging modalities such as magnetic resonance imaging (MRI) has been a second-line investigation in many countries, whereas magnetic resonance spectroscopy (MRS) has been largely confined to research applications, where significant advances in the understanding of pathophysiological mechanisms have been made. While most clinical MRI systems have operated at magnetic field strengths of 0.5-1.5 Tesla (T), higher field strength whole body systems are now increasingly becoming available at 3T and above, providing increased resolution and sensitivity. This article will review the published MR studies in HE and with the advent of new MR imaging capabilities, we speculate on areas of new research for the future.

HEPATIC ENCEPHALOPATHY

“Minimal” HE is the term used to describe the presence of cognitive impairment on psychometric testing and/or slowing of electroencephalographic (EEG) mean cycle frequency in the absence of any clinically overt signs[1,2]. This form of HE is present in the majority of patients with cirrhosis, but where the condition is more profound, it is usually characterised by remissions and relapses, manifested by obvious mood disorders, personality changes and disturbances in consciousness[1]. However, in a small minority of patients the neuropsychiatric impairment may follow a more persistent course. Elevated circulating ammonia levels, which are present owing to impaired hepatic nitrogen excretion or because of portosystemic shunting, are thought to be key to the changes in neurotransmitter systems that underlie the disturbances in function observed clinically[3]. These include increased GABA-ergic tone, elevated glutamine levels and changes in several other neurotransmitter systems and their receptors, such as reduced glutamate excitatory transmission and increased serotonergic inhibition[4]. Other abnormalities include selective alterations of blood-brain barrier permeability and changes in cerebral energy metabolism[5]. However, the central question of how these relate to elevated ammonia concentrations is an unresolved issue.

MAGNETIC RESONANCE IMAGING

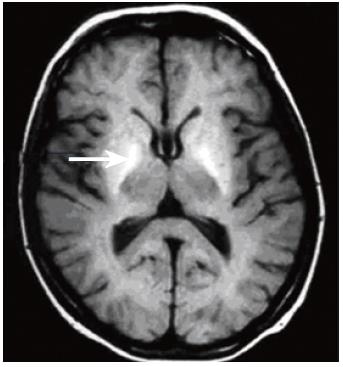
CT and MRI have long been used to detect obvious structural abnormalities in the brain such as cerebral atrophy, which occur in patients with chronic alcoholism, who do not necessarily have significant liver disease[6,7]. However, MR techniques may provide non-invasive insight into the pathogenesis of HE. Apart from structural changes associated with the direct effects of alcohol, a longstanding MR observation has been that patients with cirrhosis of any aetiology show hyperintensity in the basal ganglia on T1-weighted MRI (Figure 1)[8-11]. Hypermanganesemia due to occupational exposure or total parenteral nutrition also results in similar appearances, which reverse after correction of the blood manganese levels[12,13]. In cirrhosis, a correlation between blood manganese levels and globus pallidus signal intensity has been reported[10,14,15] and elevated post-mortem globus pallidus manganese concentrations have been detected in patients who have died with terminal liver disease[10,16]. It was initially suggested that basal ganglia hyperintensity might be an important aetiological association of the form of HE that complicates chronic liver disease[8,11]. However, a number of studies found no correlation between basal ganglia T1-weighted signal intensity and clinical encephalopathy or neuropsychological test performance[9,17,18], although the extrapyramidal symptoms seen in a minority of patients with HE may be related[14]. Instead, basal ganglia T1-weighted signal intensity and manganese accumulation appears to be related to the underlying degree of hepatic dysfunction or more particularly to the severity of cholestasis and/or the presence of portosystemic shunting, rather than directly to neuropsychiatric impairment[19]. The relationship with cholestasis is important, since manganese itself is normally eliminated from the body via the biliary route[20].

Figure 1
Figure 1 T1-weighted brain MR image through the basal ganglia acquired at 1. 5T, showing bilateral globus pallidus (arrow) hyperintensity in a patient with cirrhosis of the liver.

It has recently been proposed by Häussinger and colleagues that a major contributory event in the development of HE in patients with chronic liver disease is an increase in astrocyte hydration, or in other words, a low-grade cerebral oedema without a clinically overt increase in intracranial pressure[5]. This may occur as a consequence of ammonia uptake by astrocytes and subsequent detoxification by the enzyme glutamine synthetase to form glutamine from glutamate[3]. This deamidation process is thought to result in the accumulation of glutamine within astrocytes, which acts as a cerebral osmolyte with resultant cell swelling. With conventional neuroimaging, brain oedema is not evident in the vast majority of patients with chronic liver disease who have HE, probably because if present, the brain swelling is minimal and is thus beyond the threshold for detection on standard MRI. This is unlike the encephalopathy associated with fulminant hepatic failure, which is obviously characterised by cerebral oedema [21]. However, a number of recent studies, which employed magnetization transfer imaging (MT), suggested that there may be an increase in total brain water in the HE of chronic liver disease[22-24].

MAGNETIZATION TRANSFER IMAGING

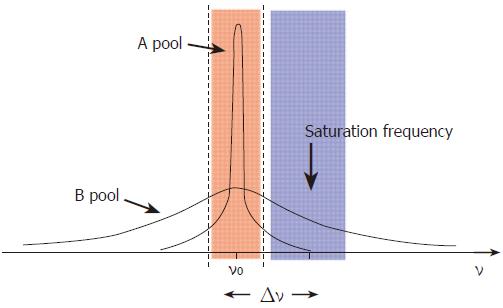
MT allows indirect measurement of bound and free water compartments in the brain and may be affected by changes in membrane fluidity, heavy metal deposition and alterations in total water content[23,24]. The technique itself is a method for manipulating tissue contrast[25,26]. In addition to enabling the acquisition of enhanced contrast images, techniques employing MT also allow the measurement of MT ratios (MTR). The MTR is a quantitative tissue characteristic that reflects the behavior of normally MR-invisible protons bound to macromolecules. MTR measurement may detect brain parenchymal changes that may not be visible using standard MR techniques. In essence, protons in tissues can be described as existing in two pools. The free pool consists of mobile protons, such as those in body water, and has a narrow spectral line with relatively long T1 and T2 relaxation times (Figure 2). The bulk of the signal in conventional MR systems comes from this free pool, as the MR excitation frequency range is narrow and centered upon these freely mobile protons. A second pool of protons bound in proteins, other macromolecules and membranes, is conventionally said to be MR invisible, as it falls outside the typical excitation range. This pool has a broad spectral line and very short relaxation times (Figure 2). Magnetization can be transferred bi-directionally between pools by direct interaction between spins, the transfer of nuclei or by direct chemical means. Under normal circumstances, the transfer of magnetization is the same in both directions.

Figure 2
Figure 2 Model demonstrating the concepts underlying the phenomenon of magnetization transfer. The free pool of protons (A) resonates at the Larmor frequency (ν0) and has a narrow spectral line. It is excited by an RF pulse which covers the frequencies shown in pink. The “bound” pool of protons (B) has a broad spectral line and can be excited and saturated by the application of RF irradiation at a frequency offset by Δν, shown in blue, without significantly affecting pool A.

Techniques that employ MT do so by saturating the magnetization in the bound pool while leaving the free pool largely unaffected. This is possible because the bound pool has a broad spectral line and can be excited by the application of an “off-resonance” RF pulse (Figure 2). This saturation results in substantial attenuation of the magnetization in the bound pool. As a consequence, there is little transfer of magnetization to the free pool and both the effective longitudinal magnetization within it and its T1 are reduced. Pulse sequences that incorporate the application of an “off-resonance” pulse can be designed to allow quantification of the effect of MT in different tissues, in health and disease[25]. Reduced MTRs may result from pathologies that alter the structural integrity and the relative macromolecular-water composition of brain parenchyma, such as in multiple sclerosis plaques or in end-stage cirrhosis[27-29]. These observations may also result from the deposition of paramagnetic substances in the brain. MR experiments with manganese chloride phantoms have demonstrated a strong inverse linear relationship between the manganese concentration and the MTR[29]. This property has been exploited for the use of paramagnetic contrast agents, such as gadolinium-based compounds. Furthermore, manganese is excreted via the biliary route and can thus accumulate in cholestatic conditions, including in the basal ganglia in patients with chronic liver disease[19]. It is of note, therefore, that our group has reported reduced MTRs in the basal ganglia of fatigued patients with primary biliary cirrhosis, which correlate strongly with ambient plasma manganese levels[30].

In the context of HE, the reported change in MTR in patients with cirrhosis could represent an alteration in the structure of cell membranes, leading to cell membrane fluidity. However, these observations may, perhaps, be accounted for by an increase in cerebral water content[22-24]. If the interpretation of the MT papers in HE is correct[22-24], an increase in brain hydration, as represented by altered MT ratios, will not be dramatic enough to cause an increase in intracranial pressure, but may reflect “lower-level” astrocyte swelling, which could be sufficient enough to trigger alterations in astrocyte function[22-24]. The possible functional effects of low grade astrocytic swelling are numerous and could possibly explain many of the features of HE complicating chronic liver disease, including alterations in blood brain barrier permeability, neurotransmitter processing and receptor density and upregulation of cerebral neurosteroid production[5]. At present, the MTR data remain an interesting observation and future studies incorporating newer MR imaging techniques are required to provide more definitive answers on pathogenesis.

DIFFUSION IMAGING

Diffusion-weighted imaging (DWI) is a method used to quantify the movement of water molecules. One of the first applications of this technique was the detection of acute cerebral ischemia in the early 1990s[31,32]. Further recognized indications include the investigation of multiple sclerosis[33] and brain tumors[34,35].

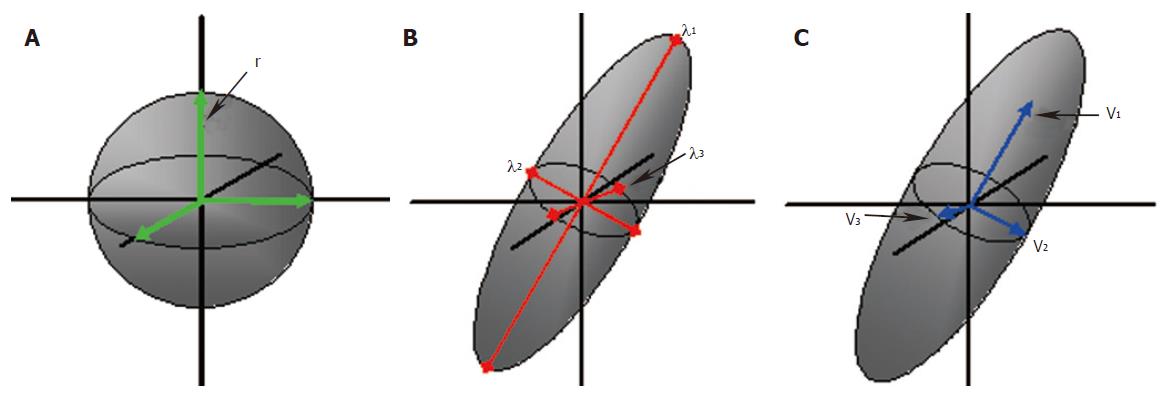
The diffusion of water molecules follows the principles of Brownian motion. Thus, when these molecules are unconstrained, their movement is random and therefore equal in all directions, being described as “isotropic”. However, the motion of water molecules in structured environments is restricted, according to the physical surroundings. The motion of water molecules in the brain is restricted by the microstructure within grey and white matter. Water molecules on average tend to move parallel to, rather than perpendicular to the white matter tracts[36,37]. This motion is described as “anisotropic”, as it is no longer equal in all directions. The motion of the molecules in the x, y and z directions and the correlation between the directions is described with the diffusion tensor[38,39]. A tensor is a mathematical construct that defines the properties of a three-dimensional ellipsoid. To define the diffusion tensor requires acquisition of diffusion data in a minimum of six non-collinear directions, this is known as diffusion tensor imaging (DTI). The diffusion tensor is graphically represented by a three-dimensional ellipsoid, with the long axis representing the primary direction of motion (Figure 3). Eigenvalues and eigenvectors describe the magnitude and directions of the three principal axes of the diffusion ellipsoid[40]. The diffusion tensor is evaluated at each pixel location and so maps of the magnitude and dominant direction of diffusion can be produced. The dominant directions can be followed from one pixel to another, plotting lines along which diffusion is likely to occur. This practice is known as tractography, the name coming from the implication that these paths are believed to represent white matter tracts. Using a minimum of 2 differently weighted DWI images, a measure of diffusion can be calculated. These data can then be mapped to create an apparent diffusion coefficient (ADC) image[41]. The ADC is a measure of tissue water diffusivity and is dependent upon interactions between water molecules and their surrounding chemical and structural environment[42]. Diffusion data may be expressed in terms of the mean diffusivity, sometimes called the mean ADC or the trace ADC. This is the average of three ADC measurements in three orthogonal directions. DTI gives rise to detailed information on the microstructure within an imaging voxel, including mean diffusivity, the degree of anisotropy and the direction of diffusivities[43]. The mean diffusivity reflects the displacement of water molecules and the presence of obstacles at both the cellular and subcellular level. Fractional anisotropy (FA) and relative anisotropy (RA) are commonly used to express the degree of anisotropy. Anisotropy will be related to the characteristics of any physical barriers, such as the orientation, density, size and shape of nerve fibers within white matter tracts. However, interestingly, myelination has been demonstrated not to be a primary determinant of anisotropy, but may indeed have modulatory effects[44]. The directionality of fibers can be expressed on color-coded two-dimensional maps, or by three-dimensional tractography images. The orientation of the major axonal fiber bundles can be calculated using the eigenvectors and eigenvalues by various algorithms[40]. The expression of DTI data in the form of 3D images is one of the latest developments in this technique and may provide insight into defects in brain connectivity (Figure 4).

Figure 3
Figure 3 Principles of diffusion: A water molecule in an unconstrained environment would move randomly and equally in all directions; isotropic diffusion (A). The probability of motion can be defined by the radius ‘r’, of the spherical range of motion. Diffusion in an ordered environment such as the white matter will assume an elliptical range of motion (B and C). Three eigenvalues, λ1, λ2 and λ3 define the shape and three eigenvectors v1, v2 and v3 define the orientation of the ellipsoid.
Figure 4
Figure 4 Color fractional anisotropy (FA) image from a 44 year-old healthy male volunteer. Diffusion tensor imaging (DTI) performed on a 3T Philips InteraTM using 32 different directions of diffusion sensitization. The different colors represent the principle diffusion directions and hence the direction of the white matter tracts: green represents anterior-posterior, blue represents caudo-cranial, red represents transverse. FA maps were generated using DTI studio version 2.1©, (Jiang and Mori, Johns Hopkins University, MD, USA).

In the field of HE, one study has looked at regional brain ADC values in patients with cirrhosis, secondary to viral hepatitis[45]. Seven patients had no encephalopathy, six had grade I and one grade II hepatic encephalopathy, according to Parsons-Smith criteria[46]. The authors found that except in the thalamus, ADC values were significantly increased in all white matter and deep grey matter areas examined. Furthermore, except for the caudate nucleus, there was a positive correlation between ADC values in all areas of the brain and venous ammonia concentrations. They suggest that their findings are related to increased brain water content, which would support the brain swelling hypothesis.

FUNCTIONAL MRI

It is well recognized that HE encompasses a broad spectrum of neuropsychiatric and cognitive impairments. Investigators have used a variety of non-invasive techniques, such as electroencephalography (EEG)[47] and magnetoencephalography (MEG) [48] to study the brains of patients with chronic liver disease, but these methodologies suffer from limited spatial resolution. Positron emission tomography (PET) has also been used to investigate both metabolic impairments and neurotransmitter deficits in patients with HE[49-52], but PET does not readily lend itself to serial studies, owing to the necessity for injection of radioactive tracers.

However, functional MRI (fMRI) provides the opportunity to study brain function in detail without the drawbacks of those other techniques, albeit with a reduced sensitivity resulting in long scan times. The most common method of assessing an alteration in cerebral activity in fMRI is by measuring the “blood oxygenation level dependent” (BOLD) signal, which represents local changes in hemoglobin oxygenation due to cerebral blood flow changes[53-55]. The signal arises because of the different magnetic properties of oxygenated hemoglobin, which is isomagnetic, and deoxyhemoglobin, which is paramagnetic relative to tissue[56]. PET studies have previously demonstrated that cerebral blood flow increases by up to 50% in response to functional activation, but the cerebral metabolic rate for oxygen increases only by 5%[57,58]. Thus, in fMRI there is a reduction in the proportion of deoxyhemoglobin, and hence in the magnetic properties of the activated brain region, which contributes to the BOLD signal. In the context of chronic liver disease, one study has used fMRI to investigate cognitive alterations in a cohort of 9 patients with minimal or “non-manifest” hepatic encephalopathy (nmHE)[59]. The patients were given a stimulus of a flickering light of decreasing frequency and were asked to indicate when the light appeared to change from a fused light to a flickering light; the “critical flicker frequency” threshold[60]. The BOLD signal was measured during this task, and the investigators observed a decrease in activation in the right inferior parietal cortex of the nmHE patients, compared to healthy age-matched volunteers. These data also suggested impaired neural connections between several cortical structures[59].

CEREBRAL BLOOD FLOW

It is well known that cerebral blood flow (CBF) changes in encephalopathic patients[49,61]. There are a variety of MRI techniques that can potentially be used to study this, including arterial spin-labeling (ASL) and contrast-enhanced perfusion MRI (CEMRI)[62-64]. Perfusion can be calculated by measuring the change in signal in the brain as a contrast agent (Gd-DTPA) flows into the brain. If an accurate measure of the arterial input function (AIF) can be extracted then quantitative measures of blood volume, flow and transit time can be calculated. Accurate measurement of the AIF is difficult and so absolute quantification is rare. In addition, the use of contrast agents is not desirable in patients with poor liver function. As always with contrast agents, longitudinal studies are also not recommended which explains the lack of such studies to date. An emerging methodology is arterial spin labeling where the blood is used as an endogenous contrast agent. The blood is tagged (usually in the carotid artery) using an RF pulse, similar to those used in standard MR imaging. The arrival of this “bolus” of tagged blood is then monitored in the brain by imaging. ASL is a very low sensitivity method compared to CEMRI and so requires significantly longer imaging times to acquire robust data (10-20 min compared to < 1 min for CEMRI). This means that ASL really only becomes feasible at higher field strengths (3T+), where imaging times become acceptable due to increased sensitivity. At the time of writing this methodology has yet to be applied to the study of HE, but the technology is now at a level of development that the known CBF changes associated with HE may be able to be quantified and response to treatment tracked using such methods.

VOLUMETRIC MRI

Until recently, MR measurement of brain and ventricular volumes was not sensitive enough for direct, serial measurement of small changes in brain size in patients with HE, who have structurally normal brains. However, the rapid development of MR analysis software now allows for precise measurements of whole or regional brain volumes and allows very small differences in brain size to be monitored that may not be visible to standard radiological inspection (coregistered MRI)[65,66]. These volume changes may be measured to allow inter- or intra-group comparisons and to follow up individuals or groups longitudinally. The techniques have been applied to a number of clinical conundra including pre-eclampsia[67-70] and given the recent interest in the possibility of low-grade oedema as a central factor in chronic HE[5], a useful application of MR is to investigate the brain volume changes that may occur in HE. One such study was performed by our group[71]. Six patients had minimal HE and three had overt HE. Seven patients were treated with lactulose for 6 weeks and three of them improved on serial psychometric testing with a consequent reduction in brain size on repeat MR imaging. Although measurable changes were found after treatment intervention, these were not correlated with the degree of encephalopathy. A recent study used voxel-based morphometric analysis of MR data to calculate brain volumes in patients with cirrhosis of varying etiologies[72]. It is not clear whether these patients were formally assessed for the presence of encephalopathy. However, the investigators found that patients with alcoholic cirrhosis had atrophy involving both grey and white matter structures[72], the latter finding in white matter is consistent with early neuropathological studies[73]. Interestingly these authors also found that patients with cirrhosis, caused by viral hepatitis also had similar, but quantitatively less atrophy[72].

LOCALIZED BRAIN WATER CONTENT

One imaging group has developed an MR technique to measure localized cerebral water content in a quantitative fashion[74,75]. This technique has been used to investigate a cohort of patients with hepatic encephalopathy[76]. Results from this pilot study show a significant correlation between the severity of HE and white matter water content. This could be a technique of great interest, if it can be translated to other MR systems in other centers around the world.

MAGNETIC RESONANCE SPECTROSCOPY

Further evidence for changes in brain hydration and cerebral osmolytes in HE which complicates chronic liver disease comes from studies using MRS. In vivo MRS is a non-invasive technique which can be used to provide localized biochemical information on cerebral metabolic processes. The underlying principles of physics that govern MRS are essentially the same as for MRI. Nearly all elements possess at least one naturally occurring isotope amenable to MR study. The most commonly used isotopes have been hydrogen-1 (1H), and phosphorus-31 (31P). 1H MRS can be utilized to provide information on brain metabolites such as choline, creatine, N-acetyl aspartate (NAA), glutamine and glutamate, as well as osmolytes such as myoinositol and taurine[77].

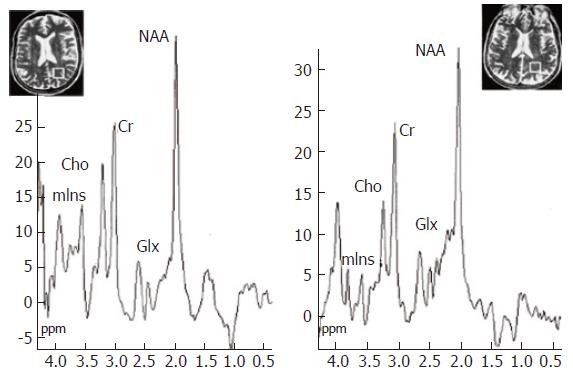
Several studies have reported characteristic spectral appearances in HE, typified by a reduction in the myoinositol and choline resonances and an increase in the glutamate/glutamine composite resonance, which correlate with neuropsychiatric impairment (Figure 5)[77-85]. Ammonia itself cannot be detected by 1H MRS, but the increase in signal from the glutamine/glutamate is likely to reflect ammonia incorporation into glutamine. The astrocyte swelling hypothesis predicts that homeostatic mechanisms occur to limit the osmotic load in astrocytes, leading to the extracellular release of osmolytes, such as myoinositol[5]. This is supported by the observation of reduced intracellular myoinositol in 1H MRS studies.

Figure 5
Figure 5 1H MR spectroscopy water-suppressed proton spectra of an 8 mL voxel located in the parietal region including predominantly normal appearing white matter (insert images show position of the voxel) in a healthy control subject (left) and in a cirrhotic patient (right), acquired using a STEAM pulse sequence [1600/20/30/256 (TR/TE/TM/acquisitions)]. The main resonances correspond to N-acetylaspartate (NAA, 2.0 ppm), glutamate/glutamine (Glx, 2.1-2.5 ppm), creatine/phosphocreatine (Cr, 3.02 ppm), choline-containing compounds (Cho, 3.2 ppm), and myo-Inositol (mIns, 3.55 ppm). Comparison of the spectra shows a decrease in Cho and mIns resonances with an increase in the glutamate/glutamine region in the cirrhotic patient. Reproduced with the permission of Springer Science and Business Media, from Cordoba et al 2002[28].

The choline resonance contains contributions from phosphocholine and glycerophosphorylcholine, which are cell membrane precursor and degradation products[86]. This observed reduction is likely to reflect alterations in phospholipid metabolism, membrane fluidity, or secondary changes in water content, because glycerophosphorylcholine is itself a cerebral osmolyte[87].

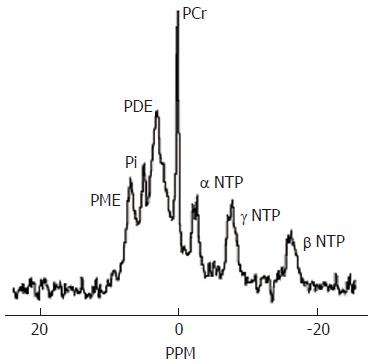
The typical cerebral 31P MR spectrum contains at least seven resonances, which can be assigned to phosphomonoesters (PME), inorganic phosphate (Pi), phosphodiesters (PDE), phosphocreatine, ATP, ATP and ATP (Figure 6)[88]. 31P MRS provides information on the status of energy phosphates and on phospholipid metabolism. Compared to 1H MRS, there is less agreement in the published cerebral 31P findings in patients with HE, due to the small populations studied and variation in the techniques that have been used. Early studies reported reductions in cerebral inorganic phosphate or phosphocreatine, which were interpreted as indicating defects in cerebral energy metabolism[89]. Our group has consistently found reductions in the PME/ATP and PDE/ATP ratios, which correlate with the reduction in choline using 1H MRS[83,84,90,91]. A recent study which used proton-decoupled 31P MRS, a technique which allows the components of the composite PDE peak to be resolved, showed a reduction in glycerophosphorylcholine, which is a major component of PDE and, as discussed above, may be reduced as a consequence of disturbances of cerebral osmoregulation[87].

Figure 6
Figure 6 Normal brain phosphorus-31 MR spectrum acquired at 1. 5T. PME = phosphomonoesters, Pi=inorganic phosphate, PDE = phosphodiesters, PCr = phosphocreatine, NTP = nucleotide triphosphate. The PME resonance provides information on cell membrane precursors and the PDE resonance on cell membrane degradation products.
FUTURE MRS DEVELOPMENTS

The current limitations of MRS include the limited resolution of metabolites which resonate within a narrow spectral range, such as glutamine and glutamate, and the inability to detect low concentration metabolites. Possible advances in the field include the use of two-dimensional spectroscopy, spectral editing and the use of higher magnetic field strength systems (for example at 3T).

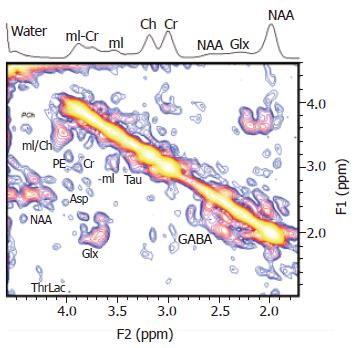
Of these, two-dimensional spectroscopy has already been used to investigate HE. Investigators have reported enhanced spectral resolution with the additional finding of an increased taurine resonance, which was well resolved [92] (Figure 7). However, currently this technique suffers from low signal-to-noise, and despite the use of a surface head coil, it is unable to probe the deeper grey matter structures, such as the basal ganglia.

Figure 7
Figure 7 A localized two-dimensional correlated spectroscopy (two-dimensional L-COSY) spectrum of a 40-year-old patient. A projected one-dimensional spectrum is also shown on top of the figure. Peaks are presented in the magnitude mode. Reproduced with permission from John Wiley and Sons Inc, from Binesh N et al 2005[92].

Spectral editing involves only the acquisition of a desired spectrum of interest by suppressing the signal of other metabolites and then attempting to acquire only the signal of interest. This approach is of importance in HE in order to separate glutamate from glutamine, which overlap in conventional MR spectra. It should be noted that spectral editing is particularly sensitive to motion artefact and instrument instability. However, these methodologies have been used to highlight taurine, GABA and myo-inositol in vivo and suppress unwanted resonances[93-95]. Such sequence development promises much in the future for HE patients, but with respect to resolving glutamate from glutamine in vivo, another approach called averaged TE spectroscopy has been used to resolve glutamate from glutamine[96]. This has been used in multiple sclerosis at 3T, but not yet in HE patients[97].

With the advent of clinical magnet systems operating at higher magnetic fields, such as 3T, which is twice that used hitherto in published studies, the sensitivity of the technique may be enhanced further with improved signal-to-noise ratios. The possibility of performing multiple MR sequences in the same examination of the brain is now possible, because acquisition times are usually faster at these higher field strengths. It will thus be feasible to perform MRS studies on cerebral osmolyte levels in the same examination as acquiring data suitable for computer-enhanced visual detection of brain swelling and fMRI which should pinpoint cognitive and perceptive derangements. Since MR does not involve ionising radiation, serial studies will be possible to look at treatment effects in HE.

CONCLUSIONS

In vivo MRI and MRS provide a non-invasive way of studying brain chemistry and metabolism in patients with liver disease. These techniques have been central in the study of the underlying mechanisms of liver-related brain disease. MRS remains a research tool in the setting of liver disease. However, simple MRS sequences can be added to a standard MR examination to provide metabolic information that could help monitor response to therapy. MR studies in HE have provided important in vivo data, which have contributed to the current theories on astrocyte swelling[5]. This model accommodates many of the common precipitating factors for CHE, such as hyponatremia, benzodiazepine administration and infection (raised inflammatory cytokines), since these events also lead to astrocyte swelling in vitro[5]. Astrocyte swelling may therefore be a common pathway for multiple synergistic factors in the pathogenesis of HE complicating chronic liver disease. However, further MR studies are clearly required before these ascertations can be confirmed. A whole variety of new MR techniques now exist to study HE in more depth.

ACKNOWLEDGEMENTS

Studies performed at the Robert Steiner MRI Unit, MRC Clinical Sciences Centre, Hammersmith Hospital Campus, Imperial College London, are supported by the United Kingdom Medical Research Council (G99000178), the Royal College of Physicians of London, Philips Medical Systems (Cleveland, Ohio, USA) and the United Kingdom Department of Health. Dr Grover is currently supported by a grant from the Paddington Charitable Trust, St Mary’s, London, United Kingdom.

Footnotes

S- Editor Wang J L- Editor Zhu LH E- Editor Ma WH

References
1.  Ferenci P, Lockwood A, Mullen K, Tarter R, Weissenborn K, Blei AT. Hepatic encephalopathy--definition, nomenclature, diagnosis, and quantification: final report of the working party at the 11th World Congresses of Gastroenterology, Vienna, 1998. Hepatology. 2002;35:716-721.  [PubMed]  [DOI]  [Cited in This Article: ]  [Cited by in Crossref: 1468]  [Cited by in F6Publishing: 1364]  [Article Influence: 62.0]  [Reference Citation Analysis (0)]
2.  Conn HO. Diuresis of ascites: fraught with or free from hazard. Gastroenterology. 1977;73:619-621.  [PubMed]  [DOI]  [Cited in This Article: ]
3.  Butterworth RF, Giguère JF, Michaud J, Lavoie J, Layrargues GP. Ammonia: key factor in the pathogenesis of hepatic encephalopathy. Neurochem Pathol. 1987;6:1-12.  [PubMed]  [DOI]  [Cited in This Article: ]  [Cited by in Crossref: 279]  [Cited by in F6Publishing: 275]  [Article Influence: 7.4]  [Reference Citation Analysis (0)]
4.  Schenker S, Brady CE. Pathogenesis of hepatic encephalopathy. Hepatic Encephalopathy: Syndromes and Therapies. Bloomington: Medi-Ed Press 1994; 43-61.  [PubMed]  [DOI]  [Cited in This Article: ]
5.  Häussinger D, Kircheis G, Fischer R, Schliess F, vom Dahl S. Hepatic encephalopathy in chronic liver disease: a clinical manifestation of astrocyte swelling and low-grade cerebral edema. J Hepatol. 2000;32:1035-1038.  [PubMed]  [DOI]  [Cited in This Article: ]  [Cited by in Crossref: 331]  [Cited by in F6Publishing: 340]  [Article Influence: 14.2]  [Reference Citation Analysis (0)]
6.  Lee K, Møller L, Hardt F, Haubek A, Jensen E. Alcohol-induced brain damage and liver damage in young males. Lancet. 1979;2:759-761.  [PubMed]  [DOI]  [Cited in This Article: ]  [Cited by in Crossref: 93]  [Cited by in F6Publishing: 101]  [Article Influence: 2.2]  [Reference Citation Analysis (0)]
7.  Charness ME. Brain lesions in alcoholics. Alcohol Clin Exp Res. 1993;17:2-11.  [PubMed]  [DOI]  [Cited in This Article: ]  [Cited by in Crossref: 170]  [Cited by in F6Publishing: 144]  [Article Influence: 4.6]  [Reference Citation Analysis (0)]
8.  Zeneroli ML, Cioni G, Crisi G, Vezzelli C, Ventura E. Globus pallidus alterations and brain atrophy in liver cirrhosis patients with encephalopathy: an MR imaging study. Magn Reson Imaging. 1991;9:295-302.  [PubMed]  [DOI]  [Cited in This Article: ]  [Cited by in Crossref: 57]  [Cited by in F6Publishing: 60]  [Article Influence: 1.8]  [Reference Citation Analysis (0)]
9.  Taylor-Robinson SD, Oatridge A, Hajnal JV, Burroughs AK, McIntyre N, deSouza NM. MR imaging of the basal ganglia in chronic liver disease: correlation of T1-weighted and magnetisation transfer contrast measurements with liver dysfunction and neuropsychiatric status. Metab Brain Dis. 1995;10:175-188.  [PubMed]  [DOI]  [Cited in This Article: ]  [Cited by in Crossref: 53]  [Cited by in F6Publishing: 56]  [Article Influence: 1.9]  [Reference Citation Analysis (0)]
10.  Krieger D, Krieger S, Jansen O, Gass P, Theilmann L, Lichtnecker H. Manganese and chronic hepatic encephalopathy. Lancet. 1995;346:270-274.  [PubMed]  [DOI]  [Cited in This Article: ]  [Cited by in Crossref: 308]  [Cited by in F6Publishing: 269]  [Article Influence: 9.3]  [Reference Citation Analysis (0)]
11.  Pujol J, Kulisevsky J, Moreno A, Deus J, Alonso J, Balanzó J, Martí-Vilalta JL, Capdevila A. Neurospectroscopic alterations and globus pallidus hyperintensity as related magnetic resonance markers of reversible hepatic encephalopathy. Neurology. 1996;47:1526-1530.  [PubMed]  [DOI]  [Cited in This Article: ]  [Cited by in Crossref: 24]  [Cited by in F6Publishing: 31]  [Article Influence: 1.1]  [Reference Citation Analysis (1)]
12.  Dietz MC, Ihrig A, Wrazidlo W, Bader M, Jansen O, Triebig G. Results of magnetic resonance imaging in long-term manganese dioxide-exposed workers. Environ Res. 2001;85:37-40.  [PubMed]  [DOI]  [Cited in This Article: ]  [Cited by in Crossref: 66]  [Cited by in F6Publishing: 62]  [Article Influence: 2.7]  [Reference Citation Analysis (0)]
13.  Mirowitz SA, Westrich TJ. Basal ganglial signal intensity alterations: reversal after discontinuation of parenteral manganese administration. Radiology. 1992;185:535-536.  [PubMed]  [DOI]  [Cited in This Article: ]
14.  Spahr L, Butterworth RF, Fontaine S, Bui L, Therrien G, Milette PC, Lebrun LH, Zayed J, Leblanc A, Pomier-Layrargues G. Increased blood manganese in cirrhotic patients: relationship to pallidal magnetic resonance signal hyperintensity and neurological symptoms. Hepatology. 1996;24:1116-1120.  [PubMed]  [DOI]  [Cited in This Article: ]  [Cited by in Crossref: 201]  [Cited by in F6Publishing: 213]  [Article Influence: 7.6]  [Reference Citation Analysis (0)]
15.  Hauser RA, Zesiewicz TA, Martinez C, Rosemurgy AS, Olanow CW. Blood manganese correlates with brain magnetic resonance imaging changes in patients with liver disease. Can J Neurol Sci. 1996;23:95-98.  [PubMed]  [DOI]  [Cited in This Article: ]
16.  Maeda H, Sato M, Yoshikawa A, Kimura M, Sonomura T, Terada M, Kishi K. Brain MR imaging in patients with hepatic cirrhosis: relationship between high intensity signal in basal ganglia on T1-weighted images and elemental concentrations in brain. Neuroradiology. 1997;39:546-550.  [PubMed]  [DOI]  [Cited in This Article: ]  [Cited by in Crossref: 93]  [Cited by in F6Publishing: 99]  [Article Influence: 3.7]  [Reference Citation Analysis (0)]
17.  Krieger S, Jauss M, Jansen O, Theilmann L, Geissler M, Krieger D. Neuropsychiatric profile and hyperintense globus pallidus on T1-weighted magnetic resonance images in liver cirrhosis. Gastroenterology. 1996;111:147-155.  [PubMed]  [DOI]  [Cited in This Article: ]  [Cited by in Crossref: 89]  [Cited by in F6Publishing: 98]  [Article Influence: 3.5]  [Reference Citation Analysis (0)]
18.  Thuluvath PJ, Edwin D, Yue NC, deVilliers C, Hochman S, Klein A. Increased signals seen in globus pallidus in T1-weighted magnetic resonance imaging in cirrhotics are not suggestive of chronic hepatic encephalopathy. Hepatology. 1995;21:440-442.  [PubMed]  [DOI]  [Cited in This Article: ]
19.  Rose C, Butterworth RF, Zayed J, Normandin L, Todd K, Michalak A, Spahr L, Huet PM, Pomier-Layrargues G. Manganese deposition in basal ganglia structures results from both portal-systemic shunting and liver dysfunction. Gastroenterology. 1999;117:640-644.  [PubMed]  [DOI]  [Cited in This Article: ]  [Cited by in Crossref: 210]  [Cited by in F6Publishing: 213]  [Article Influence: 8.5]  [Reference Citation Analysis (0)]
20.  Rodríguez-Moreno F, González-Reimers E, Santolaria-Fernández F, Galindo-Martín L, Hernandez-Torres O, Batista-López N, Molina-Perez M. Zinc, copper, manganese, and iron in chronic alcoholic liver disease. Alcohol. 1997;14:39-44.  [PubMed]  [DOI]  [Cited in This Article: ]  [Cited by in Crossref: 76]  [Cited by in F6Publishing: 77]  [Article Influence: 2.9]  [Reference Citation Analysis (0)]
21.  Wijdicks EF, Plevak DJ, Rakela J, Wiesner RH. Clinical and radiologic features of cerebral edema in fulminant hepatic failure. Mayo Clin Proc. 1995;70:119-124.  [PubMed]  [DOI]  [Cited in This Article: ]  [Cited by in Crossref: 63]  [Cited by in F6Publishing: 66]  [Article Influence: 2.3]  [Reference Citation Analysis (0)]
22.  Córdoba J, Alonso J, Rovira A, Jacas C, Sanpedro F, Castells L, Vargas V, Margarit C, Kulisewsky J, Esteban R. The development of low-grade cerebral edema in cirrhosis is supported by the evolution of (1)H-magnetic resonance abnormalities after liver transplantation. J Hepatol. 2001;35:598-604.  [PubMed]  [DOI]  [Cited in This Article: ]  [Cited by in Crossref: 187]  [Cited by in F6Publishing: 194]  [Article Influence: 8.4]  [Reference Citation Analysis (0)]
23.  Rovira A, Grivé E, Pedraza S, Rovira A, Alonso J. Magnetization transfer ratio values and proton MR spectroscopy of normal-appearing cerebral white matter in patients with liver cirrhosis. AJNR Am J Neuroradiol. 2001;22:1137-1142.  [PubMed]  [DOI]  [Cited in This Article: ]
24.  Rovira A, Córdoba J, Sanpedro F, Grivé E, Rovira-Gols A, Alonso J. Normalization of T2 signal abnormalities in hemispheric white matter with liver transplant. Neurology. 2002;59:335-341.  [PubMed]  [DOI]  [Cited in This Article: ]  [Cited by in Crossref: 58]  [Cited by in F6Publishing: 57]  [Article Influence: 2.6]  [Reference Citation Analysis (0)]
25.  Hajnal JV, Baudouin CJ, Oatridge A, Young IR, Bydder GM. Design and implementation of magnetization transfer pulse sequences for clinical use. J Comput Assist Tomogr. 1992;16:7-18.  [PubMed]  [DOI]  [Cited in This Article: ]  [Cited by in Crossref: 113]  [Cited by in F6Publishing: 116]  [Article Influence: 3.6]  [Reference Citation Analysis (0)]
26.  Wolff SD, Balaban RS. Magnetization transfer contrast (MTC) and tissue water proton relaxation in vivo. Magn Reson Med. 1989;10:135-144.  [PubMed]  [DOI]  [Cited in This Article: ]  [Cited by in Crossref: 1113]  [Cited by in F6Publishing: 1021]  [Article Influence: 29.2]  [Reference Citation Analysis (0)]
27.  van Buchem MA, Tofts PS. Magnetization transfer imaging. Neuroimaging Clin N Am. 2000;10:771-788 ,ix.  [PubMed]  [DOI]  [Cited in This Article: ]
28.  Córdoba J, Sanpedro F, Alonso J, Rovira A. 1H magnetic resonance in the study of hepatic encephalopathy in humans. Metab Brain Dis. 2002;17:415-429.  [PubMed]  [DOI]  [Cited in This Article: ]  [Cited by in Crossref: 80]  [Cited by in F6Publishing: 85]  [Article Influence: 3.9]  [Reference Citation Analysis (0)]
29.  Iwasa M, Kinosada Y, Nakatsuka A, Watanabe S, Adachi Y. Magnetization transfer contrast of various regions of the brain in liver cirrhosis. AJNR Am J Neuroradiol. 1999;20:652-654.  [PubMed]  [DOI]  [Cited in This Article: ]
30.  Forton DM, Patel N, Prince M, Oatridge A, Hamilton G, Goldblatt J, Allsop JM, Hajnal JV, Thomas HC, Bassendine M. Fatigue and primary biliary cirrhosis: association of globus pallidus magnetisation transfer ratio measurements with fatigue severity and blood manganese levels. Gut. 2004;53:587-592.  [PubMed]  [DOI]  [Cited in This Article: ]  [Cited by in Crossref: 89]  [Cited by in F6Publishing: 94]  [Article Influence: 4.7]  [Reference Citation Analysis (0)]
31.  Moseley ME, Kucharczyk J, Mintorovitch J, Cohen Y, Kurhanewicz J, Derugin N, Asgari H, Norman D. Diffusion-weighted MR imaging of acute stroke: correlation with T2-weighted and magnetic susceptibility-enhanced MR imaging in cats. AJNR Am J Neuroradiol. 1990;11:423-429.  [PubMed]  [DOI]  [Cited in This Article: ]
32.  Baird AE, Warach S. Magnetic resonance imaging of acute stroke. J Cereb Blood Flow Metab. 1998;18:583-609.  [PubMed]  [DOI]  [Cited in This Article: ]  [Cited by in Crossref: 416]  [Cited by in F6Publishing: 428]  [Article Influence: 16.5]  [Reference Citation Analysis (0)]
33.  Larsson HB, Thomsen C, Frederiksen J, Stubgaard M, Henriksen O. In vivo magnetic resonance diffusion measurement in the brain of patients with multiple sclerosis. Magn Reson Imaging. 1992;10:7-12.  [PubMed]  [DOI]  [Cited in This Article: ]  [Cited by in Crossref: 122]  [Cited by in F6Publishing: 127]  [Article Influence: 4.0]  [Reference Citation Analysis (0)]
34.  Stadnik TW, Chaskis C, Michotte A, Shabana WM, van Rompaey K, Luypaert R, Budinsky L, Jellus V, Osteaux M. Diffusion-weighted MR imaging of intracerebral masses: comparison with conventional MR imaging and histologic findings. AJNR Am J Neuroradiol. 2001;22:969-976.  [PubMed]  [DOI]  [Cited in This Article: ]
35.  Kono K, Inoue Y, Nakayama K, Shakudo M, Morino M, Ohata K, Wakasa K, Yamada R. The role of diffusion-weighted imaging in patients with brain tumors. AJNR Am J Neuroradiol. 2001;22:1081-1088.  [PubMed]  [DOI]  [Cited in This Article: ]
36.  Doran M, Hajnal JV, Van Bruggen N, King MD, Young IR, Bydder GM. Normal and abnormal white matter tracts shown by MR imaging using directional diffusion weighted sequences. J Comput Assist Tomogr. 1990;14:865-873.  [PubMed]  [DOI]  [Cited in This Article: ]  [Cited by in Crossref: 115]  [Cited by in F6Publishing: 116]  [Article Influence: 3.4]  [Reference Citation Analysis (0)]
37.  Chenevert TL, Brunberg JA, Pipe JG. Anisotropic diffusion in human white matter: demonstration with MR techniques in vivo. Radiology. 1990;177:401-405.  [PubMed]  [DOI]  [Cited in This Article: ]
38.  Basser PJ, Jones DK. Diffusion-tensor MRI: theory, experimental design and data analysis - a technical review. NMR Biomed. 2002;15:456-467.  [PubMed]  [DOI]  [Cited in This Article: ]  [Cited by in Crossref: 1077]  [Cited by in F6Publishing: 958]  [Article Influence: 43.5]  [Reference Citation Analysis (0)]
39.  Basser PJ, Mattiello J, LeBihan D. MR diffusion tensor spectroscopy and imaging. Biophys J. 1994;66:259-267.  [PubMed]  [DOI]  [Cited in This Article: ]  [Cited by in Crossref: 4249]  [Cited by in F6Publishing: 3762]  [Article Influence: 125.4]  [Reference Citation Analysis (0)]
40.  Mori S, van Zijl P. MR tractography using diffusion tensor imaging. Clinical MR Neuroimaging. 1st ed. New York: Cambridge University Press 2005; 86-98.  [PubMed]  [DOI]  [Cited in This Article: ]
41.  Mori S, Barker PB. Diffusion magnetic resonance imaging: its principle and applications. Anat Rec. 1999;257:102-109.  [PubMed]  [DOI]  [Cited in This Article: ]  [Cited by in F6Publishing: 3]  [Reference Citation Analysis (0)]
42.  Le Bihan D, Breton E, Lallemand D, Grenier P, Cabanis E, Laval-Jeantet M. MR imaging of intravoxel incoherent motions: application to diffusion and perfusion in neurologic disorders. Radiology. 1986;161:401-407.  [PubMed]  [DOI]  [Cited in This Article: ]
43.  Jones DK Fundamentals of diffusion MR imaging. In: Gillard J, Waldman A, and Barker PB Clinical MR Neuroimaging. Cambridge University Press 2005; 54-85.  [PubMed]  [DOI]  [Cited in This Article: ]
44.  Beaulieu C. The basis of anisotropic water diffusion in the nervous system - a technical review. NMR Biomed. 2002;15:435-455.  [PubMed]  [DOI]  [Cited in This Article: ]  [Cited by in Crossref: 3340]  [Cited by in F6Publishing: 3242]  [Article Influence: 147.4]  [Reference Citation Analysis (0)]
45.  Lodi R, Tonon C, Stracciari A, Weiger M, Camaggi V, Iotti S, Donati G, Guarino M, Bolondi L, Barbiroli B. Diffusion MRI shows increased water apparent diffusion coefficient in the brains of cirrhotics. Neurology. 2004;62:762-766.  [PubMed]  [DOI]  [Cited in This Article: ]  [Cited by in Crossref: 78]  [Cited by in F6Publishing: 75]  [Article Influence: 3.8]  [Reference Citation Analysis (0)]
46.  PARSONS-SMITH BG, SUMMERSKILL WH, DAWSON AM, SHERLOCK S. The electroencephalograph in liver disease. Lancet. 1957;273:867-871.  [PubMed]  [DOI]  [Cited in This Article: ]  [Cited by in Crossref: 307]  [Cited by in F6Publishing: 313]  [Article Influence: 4.7]  [Reference Citation Analysis (0)]
47.  Davies MG, Rowan MJ, Feely J. EEG and event related potentials in hepatic encephalopathy. Metab Brain Dis. 1991;6:175-186.  [PubMed]  [DOI]  [Cited in This Article: ]  [Cited by in Crossref: 21]  [Cited by in F6Publishing: 22]  [Article Influence: 0.7]  [Reference Citation Analysis (0)]
48.  Timmermann L, Gross J, Butz M, Kircheis G, Haussinger D, Schnitzler A. Pathological oscillatory coupling within the human motor system in different tremor syndromes as revealed by magnetoencephalography. Neurol Clin Neurophysiol. 2004;2004:26.  [PubMed]  [DOI]  [Cited in This Article: ]
49.  Lockwood AH. Positron emission tomography in the study of hepatic encephalopathy. Metab Brain Dis. 2002;17:431-435.  [PubMed]  [DOI]  [Cited in This Article: ]  [Cited by in Crossref: 22]  [Cited by in F6Publishing: 22]  [Article Influence: 1.0]  [Reference Citation Analysis (0)]
50.  Lockwood AH. Positron emission tomography in the study of hepatic encephalopathy. Metab Brain Dis. 1998;13:303-309.  [PubMed]  [DOI]  [Cited in This Article: ]  [Cited by in Crossref: 7]  [Cited by in F6Publishing: 8]  [Article Influence: 0.3]  [Reference Citation Analysis (0)]
51.  Jalan R, Turjanski N, Taylor-Robinson SD, Koepp MJ, Richardson MP, Wilson JA, Bell JD, Brooks DJ. Increased availability of central benzodiazepine receptors in patients with chronic hepatic encephalopathy and alcohol related cirrhosis. Gut. 2000;46:546-552.  [PubMed]  [DOI]  [Cited in This Article: ]  [Cited by in Crossref: 35]  [Cited by in F6Publishing: 40]  [Article Influence: 1.7]  [Reference Citation Analysis (0)]
52.  Cagnin A, Taylor-Robinson SD, Forton DM, Banati RB. In vivo imaging of cerebral "peripheral benzodiazepine binding sites" in patients with hepatic encephalopathy. Gut. 2006;55:547-553.  [PubMed]  [DOI]  [Cited in This Article: ]  [Cited by in Crossref: 79]  [Cited by in F6Publishing: 83]  [Article Influence: 4.6]  [Reference Citation Analysis (0)]
53.  Jezzard P. Functional MRI. Tofts PS. 1 ed. America: Wiley 2003; 413-53.  [PubMed]  [DOI]  [Cited in This Article: ]
54.  Ogawa S, Tank DW, Menon R, Ellermann JM, Kim SG, Merkle H, Ugurbil K. Intrinsic signal changes accompanying sensory stimulation: functional brain mapping with magnetic resonance imaging. Proc Natl Acad Sci U S A. 1992;89:5951-5955.  [PubMed]  [DOI]  [Cited in This Article: ]  [Cited by in Crossref: 2550]  [Cited by in F6Publishing: 2237]  [Article Influence: 69.9]  [Reference Citation Analysis (0)]
55.  Kwong KK, Belliveau JW, Chesler DA, Goldberg IE, Weisskoff RM, Poncelet BP, Kennedy DN, Hoppel BE, Cohen MS, Turner R. Dynamic magnetic resonance imaging of human brain activity during primary sensory stimulation. Proc Natl Acad Sci U S A. 1992;89:5675-5679.  [PubMed]  [DOI]  [Cited in This Article: ]  [Cited by in Crossref: 3003]  [Cited by in F6Publishing: 2623]  [Article Influence: 82.0]  [Reference Citation Analysis (0)]
56.  Pauling L, Coryell CD. The Magnetic Properties and Structure of Hemoglobin, Oxyhemoglobin and Carbonmonoxyhemoglobin. Proc Natl Acad Sci U S A. 1936;22:210-216.  [PubMed]  [DOI]  [Cited in This Article: ]  [Cited by in Crossref: 731]  [Cited by in F6Publishing: 566]  [Article Influence: 31.4]  [Reference Citation Analysis (0)]
57.  Fox PT, Raichle ME, Mintun MA, Dence C. Nonoxidative glucose consumption during focal physiologic neural activity. Science. 1988;241:462-464.  [PubMed]  [DOI]  [Cited in This Article: ]  [Cited by in Crossref: 1252]  [Cited by in F6Publishing: 1107]  [Article Influence: 30.8]  [Reference Citation Analysis (0)]
58.  Fox PT, Raichle ME. Focal physiological uncoupling of cerebral blood flow and oxidative metabolism during somatosensory stimulation in human subjects. Proc Natl Acad Sci U S A. 1986;83:1140-1144.  [PubMed]  [DOI]  [Cited in This Article: ]  [Cited by in Crossref: 1420]  [Cited by in F6Publishing: 1243]  [Article Influence: 32.7]  [Reference Citation Analysis (0)]
59.  Zafiris O, Kircheis G, Rood HA, Boers F, Häussinger D, Zilles K. Neural mechanism underlying impaired visual judgement in the dysmetabolic brain: an fMRI study. Neuroimage. 2004;22:541-552.  [PubMed]  [DOI]  [Cited in This Article: ]  [Cited by in Crossref: 73]  [Cited by in F6Publishing: 75]  [Article Influence: 3.8]  [Reference Citation Analysis (0)]
60.  Kircheis G, Wettstein M, Timmermann L, Schnitzler A, Häussinger D. Critical flicker frequency for quantification of low-grade hepatic encephalopathy. Hepatology. 2002;35:357-366.  [PubMed]  [DOI]  [Cited in This Article: ]  [Cited by in Crossref: 293]  [Cited by in F6Publishing: 252]  [Article Influence: 11.5]  [Reference Citation Analysis (0)]
61.  Iwasa M, Matsumura K, Kaito M, Ikoma J, Kobayashi Y, Nakagawa N, Watanabe S, Takeda K, Adachi Y. Decrease of regional cerebral blood flow in liver cirrhosis. Eur J Gastroenterol Hepatol. 2000;12:1001-1006.  [PubMed]  [DOI]  [Cited in This Article: ]  [Cited by in Crossref: 32]  [Cited by in F6Publishing: 32]  [Article Influence: 1.3]  [Reference Citation Analysis (0)]
62.  Yang Y, Frank JA, Hou L, Ye FQ, McLaughlin AC, Duyn JH. Multislice imaging of quantitative cerebral perfusion with pulsed arterial spin labeling. Magn Reson Med. 1998;39:825-832.  [PubMed]  [DOI]  [Cited in This Article: ]  [Cited by in Crossref: 135]  [Cited by in F6Publishing: 139]  [Article Influence: 5.3]  [Reference Citation Analysis (0)]
63.  Golay X, Hendrikse J, Lim TC. Perfusion imaging using arterial spin labeling. Top Magn Reson Imaging. 2004;15:10-27.  [PubMed]  [DOI]  [Cited in This Article: ]  [Cited by in Crossref: 195]  [Cited by in F6Publishing: 165]  [Article Influence: 8.3]  [Reference Citation Analysis (0)]
64.  Calamante F. Bolus dispersion issues related to the quantification of perfusion MRI data. J Magn Reson Imaging. 2005;22:718-722.  [PubMed]  [DOI]  [Cited in This Article: ]  [Cited by in Crossref: 63]  [Cited by in F6Publishing: 65]  [Article Influence: 3.6]  [Reference Citation Analysis (0)]
65.  Oatridge A The use of subvoxel image registration and subtraction of serial magnetic resonance imaging for detecting small changes to the brain. Leeds: Leeds Metropolitan University; 1998; 96-116.  [PubMed]  [DOI]  [Cited in This Article: ]
66.  Saeed N. Magnetic resonance image segmentation using pattern recognition, and applied to image registration and quantitation. NMR Biomed. 1998;11:157-167.  [PubMed]  [DOI]  [Cited in This Article: ]
67.  Oatridge A, Barnard ML, Puri BK, Taylor-Robinson SD, Hajnal JV, Saeed N, Bydder GM. Changes in brain size with treatment in patients with hyper- or hypothyroidism. AJNR Am J Neuroradiol. 2002;23:1539-1544.  [PubMed]  [DOI]  [Cited in This Article: ]
68.  Oatridge A, Holdcroft A, Saeed N, Hajnal JV, Puri BK, Fusi L, Bydder GM. Change in brain size during and after pregnancy: study in healthy women and women with preeclampsia. AJNR Am J Neuroradiol. 2002;23:19-26.  [PubMed]  [DOI]  [Cited in This Article: ]
69.  Saeed N, Puri BK, Oatridge A, Hajnal JV, Young IR. Two methods for semi-automated quantification of changes in ventricular volume and their use in schizophrenia. Magn Reson Imaging. 1998;16:1237-1247.  [PubMed]  [DOI]  [Cited in This Article: ]  [Cited by in Crossref: 11]  [Cited by in F6Publishing: 12]  [Article Influence: 0.5]  [Reference Citation Analysis (0)]
70.  Hajnal JV, Hill DLG, Hawkes DJ, Medical Image Registration.  In: The Biomedical Engineering Series. Florida, USA: CRC Press 2001; 143-182.  [PubMed]  [DOI]  [Cited in This Article: ]
71.  Patel N, White S, Dhanjal NS, Oatridge A, Taylor-Robinson SD. Changes in brain size in hepatic encephalopathy: a coregistered MRI study. Metab Brain Dis. 2004;19:431-445.  [PubMed]  [DOI]  [Cited in This Article: ]  [Cited by in Crossref: 20]  [Cited by in F6Publishing: 22]  [Article Influence: 1.1]  [Reference Citation Analysis (0)]
72.  Testa C, Gomez-Anson B, Gines P, Torre A, Alayrach E, Frisoni G; Brain changes in cirrhosis: A voxel based morphometry study. Proceedings of the 11th Annual Meeting of the Organization for Human Brain Mapping; 2005. Toronto, Canada, Abstract No. 4.  .  [PubMed]  [DOI]  [Cited in This Article: ]
73.  Harper C, Corbett D. Changes in the basal dendrites of cortical pyramidal cells from alcoholic patients--a quantitative Golgi study. J Neurol Neurosurg Psychiatry. 1990;53:856-861.  [PubMed]  [DOI]  [Cited in This Article: ]  [Cited by in Crossref: 96]  [Cited by in F6Publishing: 95]  [Article Influence: 2.8]  [Reference Citation Analysis (0)]
74.  Shah NJ, Zaitsev M, Steinhoff S, Zilles K. A new method for fast multislice T(1) mapping. Neuroimage. 2001;14:1175-1185.  [PubMed]  [DOI]  [Cited in This Article: ]  [Cited by in Crossref: 65]  [Cited by in F6Publishing: 64]  [Article Influence: 2.8]  [Reference Citation Analysis (0)]
75.  Steinhoff S, Zaitsev M, Zilles K, Shah NJ. Fast T(1) mapping with volume coverage. Magn Reson Med. 2001;46:131-140.  [PubMed]  [DOI]  [Cited in This Article: ]  [Cited by in Crossref: 62]  [Cited by in F6Publishing: 61]  [Article Influence: 2.7]  [Reference Citation Analysis (0)]
76.  Neeb H, Kircheis G, Haussinger D, Zilles K, Shah NJ.  Quantitative Measurement of Absolute Water Content in Hepatic Encephalopathy. Proceedings of the 13th Scientific Meeting International Society of Magnetic Resonance in Medicine; 2005, Miami, USA. .  [PubMed]  [DOI]  [Cited in This Article: ]
77.  Ross B, Kreis R, Ernst T. Clinical tools for the 90s: magnetic resonance spectroscopy and metabolite imaging. Eur J Radiol. 1992;14:128-140.  [PubMed]  [DOI]  [Cited in This Article: ]  [Cited by in Crossref: 96]  [Cited by in F6Publishing: 106]  [Article Influence: 3.3]  [Reference Citation Analysis (0)]
78.  Chamuleau RA, Bosman DK, Bovée WM, Luyten PR, den Hollander JA. What the clinician can learn from MR glutamine/glutamate assays. NMR Biomed. 1991;4:103-108.  [PubMed]  [DOI]  [Cited in This Article: ]
79.  Kreis R, Ross BD, Farrow NA, Ackerman Z. Metabolic disorders of the brain in chronic hepatic encephalopathy detected with H-1 MR spectroscopy. Radiology. 1992;182:19-27.  [PubMed]  [DOI]  [Cited in This Article: ]
80.  Ross BD, Jacobson S, Villamil F, Korula J, Kreis R, Ernst T, Shonk T, Moats RA. Subclinical hepatic encephalopathy: proton MR spectroscopic abnormalities. Radiology. 1994;193:457-463.  [PubMed]  [DOI]  [Cited in This Article: ]
81.  Häussinger D, Laubenberger J, vom Dahl S, Ernst T, Bayer S, Langer M, Gerok W, Hennig J. Proton magnetic resonance spectroscopy studies on human brain myo-inositol in hypo-osmolarity and hepatic encephalopathy. Gastroenterology. 1994;107:1475-1480.  [PubMed]  [DOI]  [Cited in This Article: ]  [Cited by in Crossref: 303]  [Cited by in F6Publishing: 278]  [Article Influence: 9.3]  [Reference Citation Analysis (0)]
82.  Taylor-Robinson SD, Sargentoni J, Marcus CD, Morgan MY, Bryant DJ. Regional variations in cerebral proton spectroscopy in patients with chronic hepatic encephalopathy. Metab Brain Dis. 1994;9:347-359.  [PubMed]  [DOI]  [Cited in This Article: ]  [Cited by in Crossref: 59]  [Cited by in F6Publishing: 72]  [Article Influence: 2.4]  [Reference Citation Analysis (0)]
83.  Taylor-Robinson SD, Sargentoni J, Oatridge A, Bryant DJ, Hajnal JV, Marcus CD, Seery JP, Hodgson HJ, deSouza NM. MR imaging and spectroscopy of the basal ganglia in chronic liver disease: correlation of T1-weighted contrast measurements with abnormalities in proton and phosphorus-31 MR spectra. Metab Brain Dis. 1996;11:249-268.  [PubMed]  [DOI]  [Cited in This Article: ]  [Cited by in Crossref: 32]  [Cited by in F6Publishing: 33]  [Article Influence: 1.2]  [Reference Citation Analysis (0)]
84.  Taylor-Robinson SD, Buckley C, Changani KK, Hodgson HJ, Bell JD. Cerebral proton and phosphorus-31 magnetic resonance spectroscopy in patients with subclinical hepatic encephalopathy. Liver. 1999;19:389-398.  [PubMed]  [DOI]  [Cited in This Article: ]  [Cited by in Crossref: 36]  [Cited by in F6Publishing: 39]  [Article Influence: 1.6]  [Reference Citation Analysis (0)]
85.  Laubenberger J, Häussinger D, Bayer S, Gufler H, Hennig J, Langer M. Proton magnetic resonance spectroscopy of the brain in symptomatic and asymptomatic patients with liver cirrhosis. Gastroenterology. 1997;112:1610-1616.  [PubMed]  [DOI]  [Cited in This Article: ]  [Cited by in Crossref: 150]  [Cited by in F6Publishing: 157]  [Article Influence: 5.8]  [Reference Citation Analysis (0)]
86.  Miller BL. A review of chemical issues in 1H NMR spectroscopy: N-acetyl-L-aspartate, creatine and choline. NMR Biomed. 1991;4:47-52.  [PubMed]  [DOI]  [Cited in This Article: ]
87.  Bluml S, Zuckerman E, Tan J, Ross BD. Proton-decoupled 31P magnetic resonance spectroscopy reveals osmotic and metabolic disturbances in human hepatic encephalopathy. J Neurochem. 1998;71:1564-1576.  [PubMed]  [DOI]  [Cited in This Article: ]  [Cited by in Crossref: 49]  [Cited by in F6Publishing: 48]  [Article Influence: 1.8]  [Reference Citation Analysis (0)]
88.  Bottomley PA, Hart HR Jr, Edelstein WA, Schenck JF, Smith LS, Leue WM, Mueller OM, Redington RW. Anatomy and metabolism of the normal human brain studied by magnetic resonance at 1.5 Tesla. Radiology. 1984;150:441-446.  [PubMed]  [DOI]  [Cited in This Article: ]
89.  Barbiroli B, Lodi R, Sama C, Bolondi L, Malavolti M, Brillanti S.  Abnormal brain energy metabolism detected by 31P MRS in patients with chronic liver disease. 1992;3: 1919.  [PubMed]  [DOI]  [Cited in This Article: ]
90.  Patel N, Forton DM, Coutts GA, Thomas HC, Taylor-Robinson SD. Intracellular pH measurements of the whole head and the basal ganglia in chronic liver disease: a phosphorus-31 MR spectroscopy study. Metab Brain Dis. 2000;15:223-240.  [PubMed]  [DOI]  [Cited in This Article: ]  [Cited by in Crossref: 14]  [Cited by in F6Publishing: 17]  [Article Influence: 0.7]  [Reference Citation Analysis (0)]
91.  Taylor-Robinson SD, Sargentoni J, Mallalieu RJ, Bell JD, Bryant DJ, Coutts GA, Morgan MY. Cerebral phosphorus-31 magnetic resonance spectroscopy in patients with chronic hepatic encephalopathy. Hepatology. 1994;20:1173-1178.  [PubMed]  [DOI]  [Cited in This Article: ]  [Cited by in Crossref: 35]  [Cited by in F6Publishing: 33]  [Article Influence: 1.1]  [Reference Citation Analysis (0)]
92.  Binesh N, Huda A, Bugbee M, Gupta R, Rasgon N, Kumar A, Green M, Han S, Thomas MA. Adding another spectral dimension to 1H magnetic resonance spectroscopy of hepatic encephalopathy. J Magn Reson Imaging. 2005;21:398-405.  [PubMed]  [DOI]  [Cited in This Article: ]  [Cited by in Crossref: 25]  [Cited by in F6Publishing: 24]  [Article Influence: 1.3]  [Reference Citation Analysis (0)]
93.  Lei H, Peeling J. A localized double-quantum filter for in vivo detection of taurine. Magn Reson Med. 1999;42:454-460.  [PubMed]  [DOI]  [Cited in This Article: ]  [Cited by in F6Publishing: 1]  [Reference Citation Analysis (0)]
94.  Shen J, Yang J, Choi IY, Li SS, Chen Z. A new strategy for in vivo spectral editing. Application to GABA editing using selective homonuclear polarization transfer spectroscopy. J Magn Reson. 2004;170:290-298.  [PubMed]  [DOI]  [Cited in This Article: ]  [Cited by in Crossref: 28]  [Cited by in F6Publishing: 25]  [Article Influence: 1.3]  [Reference Citation Analysis (0)]
95.  Choi C, Ogilvie CJ, Malykhin N, Ngo JT, Hartfeil MA, Coupland NJ. Detection of the myo-inositol 4.06-ppm resonance by selective J rewinding: application to human prefrontal cortex in vivo. Magn Reson Med. 2005;54:1536-1540.  [PubMed]  [DOI]  [Cited in This Article: ]  [Cited by in Crossref: 5]  [Cited by in F6Publishing: 5]  [Article Influence: 0.3]  [Reference Citation Analysis (0)]
96.  Hurd R, Sailasuta N, Srinivasan R, Vigneron DB, Pelletier D, Nelson SJ. Measurement of brain glutamate using TE-averaged PRESS at 3T. Magn Reson Med. 2004;51:435-440.  [PubMed]  [DOI]  [Cited in This Article: ]  [Cited by in Crossref: 200]  [Cited by in F6Publishing: 180]  [Article Influence: 9.0]  [Reference Citation Analysis (0)]
97.  Srinivasan R, Sailasuta N, Hurd R, Nelson S, Pelletier D. Evidence of elevated glutamate in multiple sclerosis using magnetic resonance spectroscopy at 3 T. Brain. 2005;128:1016-1025.  [PubMed]  [DOI]  [Cited in This Article: ]  [Cited by in Crossref: 339]  [Cited by in F6Publishing: 324]  [Article Influence: 17.1]  [Reference Citation Analysis (0)]